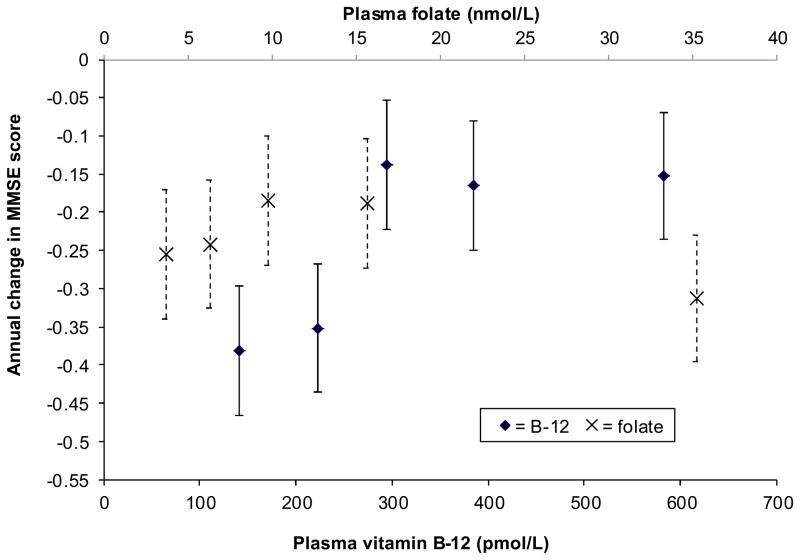
Figure 1.
Annual change in MMSE score during the 8 years between examinations 20 (baseline) and 24 of the Framingham Original Cohort (n = 549) by baseline plasma vitamin B-12 and plasma folate quintile categories. Results are controlled for age, sex, educational achievement, body mass index, and baseline status for plasma vitamin B-12 or folate. Points represent β-coefficients, which are plotted at quintile category medians. Error bars represent 95% CI for the β-coefficients. For vitamin B-12, quintile categories 1–3 do not differ from each other, and quintile categories 4 and 5 do not differ from each other, but 1–3 and 4/5 differ significantly. P<0.001 for the interaction between time and plasma vitamin B-12. For folate, quintile category 5 differs significantly from quintile categories 2 and 3; quintile categories 1 and 2 do not differ from any of the other categories. P = 0.019 for the interaction between time and plasma folate.

