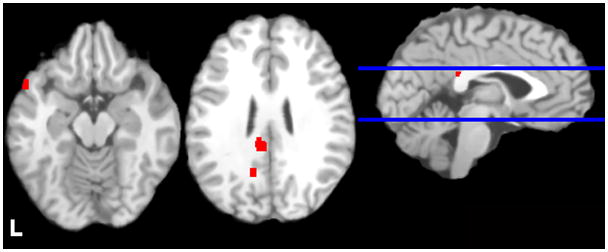
Figure 2.

Regions of alcohol cue-elicited activation that were greater in cases than controls. Images are neurologically oriented and thresholded at a voxel-wise p < .05 (FDR corrected for multiple comparisons), with clusters > 200 mm3. Talairach z coordinates of displayed slices are, from left to right, −15 and 25. Bl ue lines display location of these slices.
