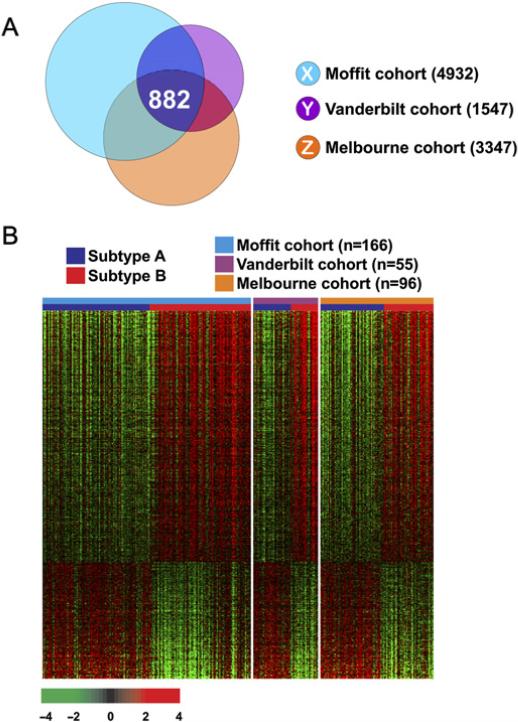
Figure 4.
Subtype-specific gene expression patterns conserved in all three cohorts of patients with colorectal cancer. (A) Venn diagram of genes with expression that differed significantly between patients with colorectal cancer in subtypes A and B in the three different cohorts. Univariate test (two-sample t test) with multivariate permutation test (10 000 random permutations) was applied. In each comparison, we applied a cut-off p value of less than 0.001 to retain genes with expression that differed significantly between the two groups of tissues examined. (B) Expression patterns of selected genes shared in the three colon cancer cohorts. The expressions of only 882 genes were commonly upregulated or downregulated in all three cohorts. Colored bars at the top of the heat map represent samples as indicated.

