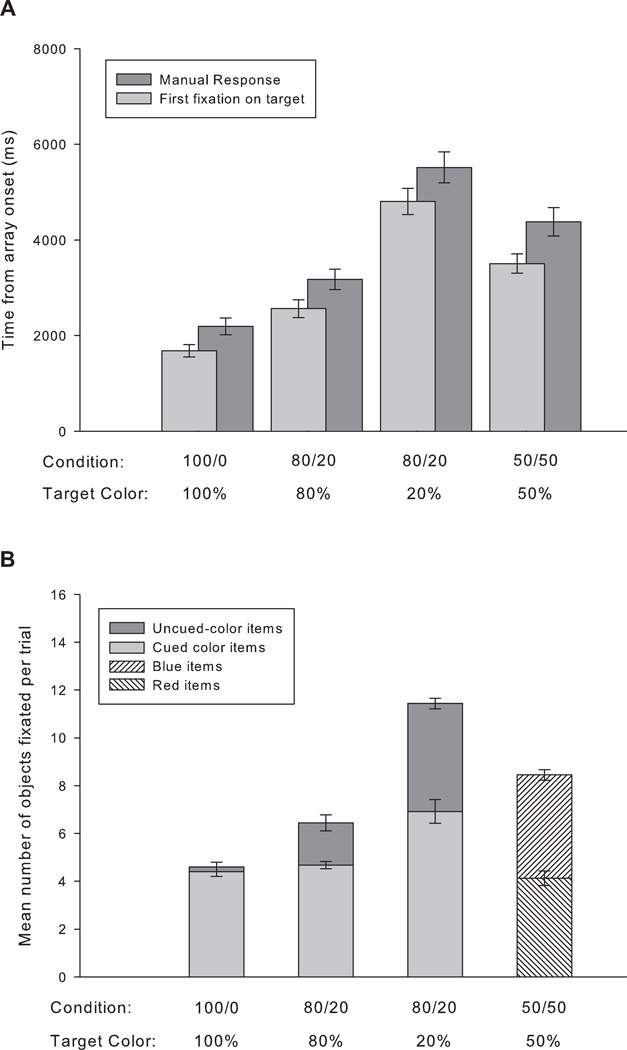
Figure 2.
A) Mean time to the manual response (dark grey) and mean time to target fixation (light grey). B) Stacked bars indicate mean number of uncued- (dark grey), cued-color (light grey), or total (dark grey + light grey) objects fixated per trial. Since neither color was cued in the 50% condition, the columns represent mean number of blue (right diagonal) or red (left diagonal) objects fixated per trial. Error bars represent within-subject confidence intervals (Morey, 2008).

