
Figure 7.
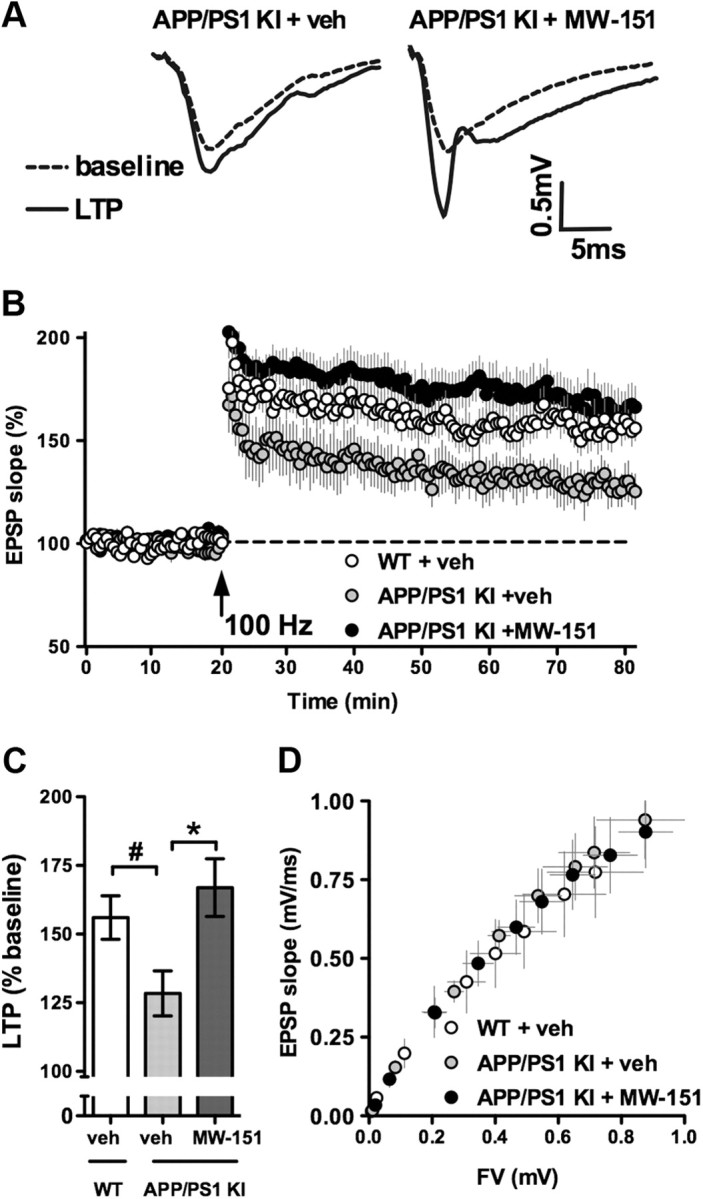
MW-151 increases LTP in the hippocampus of 12-month-old APP/PS1 mice. A, Representative CA3-CA1 synaptic responses from vehicle (veh)-treated and 30 μm MW-151-treated hippocampal slices from APP/PS1 mice, collected immediately before (dashed line) and 60 min after (solid line) LTP induction. B, Time plot of EPSP slope measures taken before and after 100 Hz stimulation in slices from WT mice (white circles) and APP/PS1 mice treated with (black circles) or without (gray circles) MW-151. C, Bar graph shows LTP levels across treatment conditions. Number symbol (#) indicates a significant decrease (p < 0.05) in LTP in vehicle-treated slices from APP/PS1 mice compared to vehicle-treated slices from WT mice. Asterisk indicates a significant increase (p < 0.05) in LTP in MW-151-treated slices from APP/PS1 mice relative to the APP/PS1 vehicle group. D, EPSP slope measures plotted against FV measures in each treatment condition. No effects of genotype or MW-151 treatment on synaptic strength were observed.