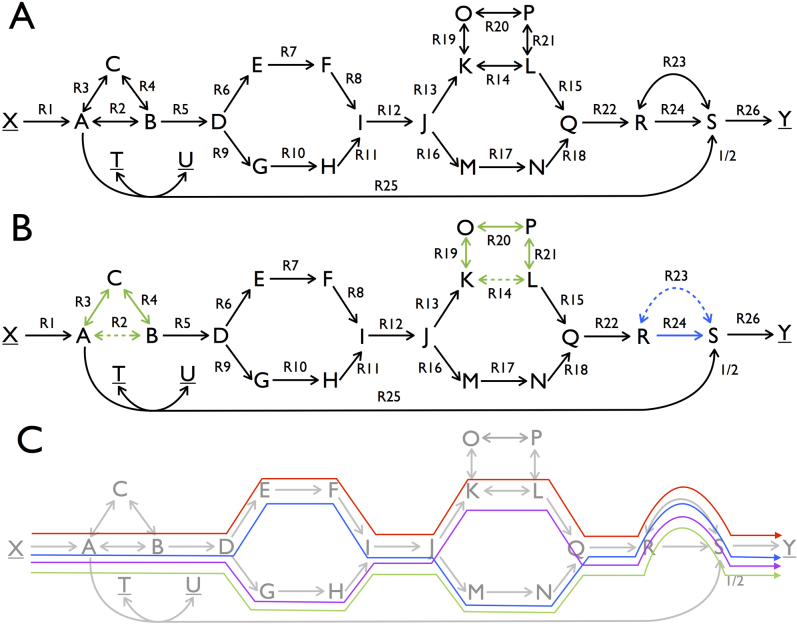
Figure 1. Topological characterization of the optimal solution space of an artificial metabolic network in terms of vertices, rays, and linealities.
A. A metabolic network with 23 metabolites and 26 reactions. The source and sink metabolites, X, Y, T and U, are underlined to indicate that their concentrations are considered fixed in order to ensure a steady state, which we assume to be stable. Reversible reactions are depicted by two-way arrows, irreversible reactions by one-way arrows. A reaction carries a positive flux when running from lower alphabetic to higher alphabetic order (e.g for R19 and R21 production of O and L correspond to positive fluxes). FBA was applied to maximize the flux through reaction R26 under the constraint that the flux of reaction R1 is smaller than or equal to 1. B. Overview of the linealities (green subnetworks) and the single ray (blue) that exist for this FBA program. The linealities correspond to reversible cycles whereas rays resemble irreversible cycles. These cycles are elementally balanced, such that no net conversions take place. Irreversible cycles (rays) are thermodynamically infeasible. The reactions in these cycles that are dashed in the figure show a choice of reactions included in vertices. C. The four vertices of this FBA solution space are displayed. They each represent a route from source to sink metabolites that have the same maximal yield. Reaction R25 is not used among the optimal vertices because it would give rise a lower yield than any of the other vertices. Any optimal flux distributions can be reconstructed from the vertex, rays, and linealities.

