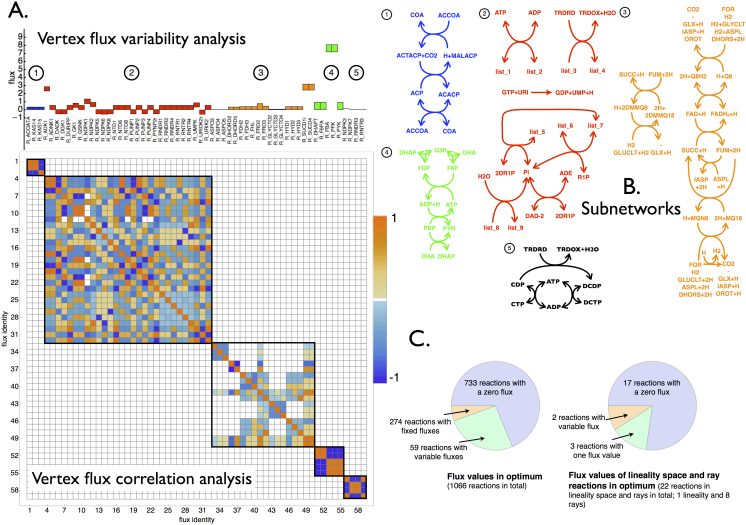
Figure 2. Topological characterization of the optimal solution space with CoPE-FBA of Escherichia coli iJR904 growing on mineral medium supplemented with glucose as carbon source.
A. The flux variability analysis of the 59 reactions that display variable fluxes across all the vertices. The color coding refers to the five different subnetworks. The symmetric matrix with Pearson correlation coefficients is always displayed and indicates the five subnetworks that vary independently in flux value across all 17280 vertices. B. Depiction of the network topology of the five subnetworks. List_1, list_2, list_3 and list_4 denote the following ordered lists of reactants respectively: {DGMP, GMP, GSN, AMP, DAMP, UDP, DGDP, DUDP, DADP, UMP, DUMP, DUMP, GDP, ADN}, {DGDP, GDP, GMP+H,ADP, DADP, UTP, DGTP, DUTP, DATP, UDP, DUDP, GTP, AMP+H}, {ADP, GDP, UDP, GTP, UTP, ATP}, {DADP, DGDP, DUDP, DGTP, DUTP, DATP}. Subnetwork 1 is composed out of 3 reactions and has 2 different flux distributions across all vertices. Subnetwork 2 contains 9 reactions and has 24 different flux distributions across all vertices. Subnetwork 3 contains 18 reactions and achieves 90 different flux distributions across all vertices. Subnetwork 4 contains 5 reactions and carries 2 different flux distributions. Subnetwork 5 carries 4 reactions and 2 different flux distributions across all vertices. Since all the flux distributions of the subnetwork occur independently the total number of vertices equals 2 × 24 × 90 × 2 × 2 = 17280. C. Two piecharts indicating the numbers of variable fluxes among the vertices, the rays, and the linealities.

