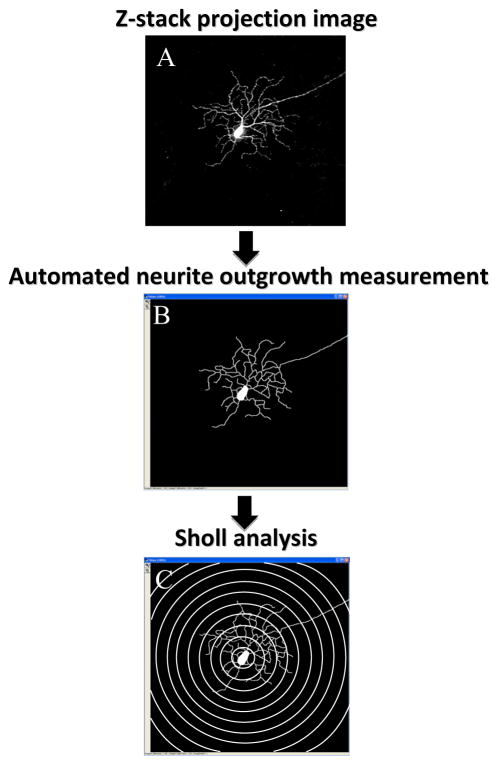
Figure 2.
A graphical representation of neurite outgrowth and Sholl analysis measurements. A 2-dimensional 16-bit TIFF image (A) was generated from the z stack of images that were captured using confocal microscopy. The automated macro that contains both a proprietary neurite outgrowth measurement program (B) and a Sholl rings’ template (C) was applied for detailed morphological analysis.

