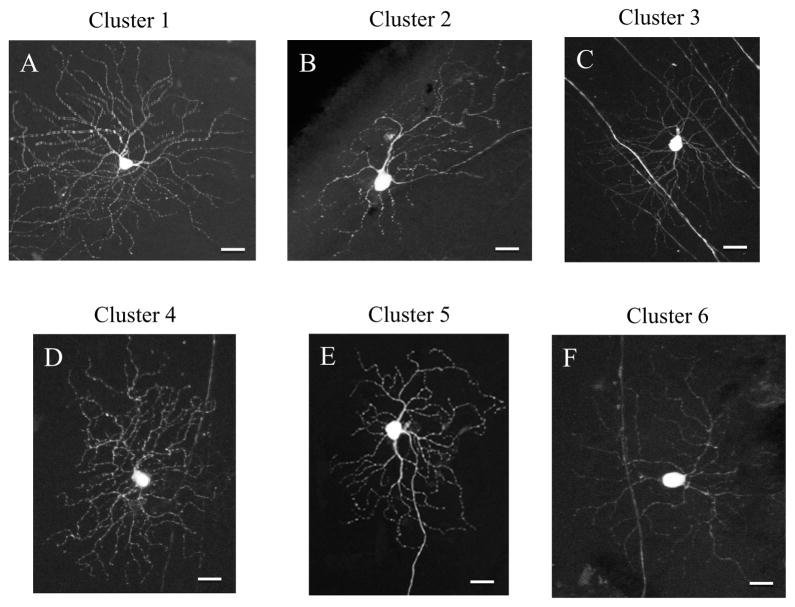
Figure 6.
YFP expressing RGCs were grouped into 6 different clusters of cells according to their neurite outgrowth parameters, soma size and depth of stratification in the inner plexiform layer. Cells from cluster 1 (A) had the highest depth of dendritic stratification. Cluster 2 cells (B) had bigger cell soma than cells in cluster 1, whereas cells from cluster 3 (C) had the highest total outgrowth of the dendritic arbor. Cells that were identified as cluster 4 (D) had low number of primary processes and dendritic branches, whereas cluster 5 cells (E) were the biggest in soma size and have one of the longest total outgrowth. Cells from cluster 6 (F) had the lowest number of branches and primary processes. Scale bar = 20 μm.

