Figure 3.

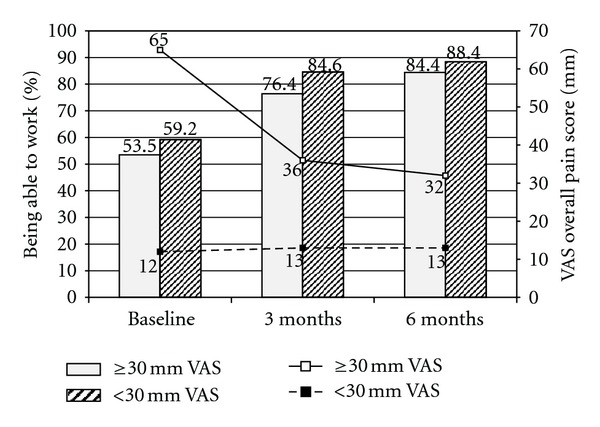
Subgroup analysis by baseline pain severity (<30 mm VAS versus ≥30 mm VAS) for % patients being able to work and mean VAS overall pain score at baseline, 3 months and 6 months.

Subgroup analysis by baseline pain severity (<30 mm VAS versus ≥30 mm VAS) for % patients being able to work and mean VAS overall pain score at baseline, 3 months and 6 months.