Figure 7.

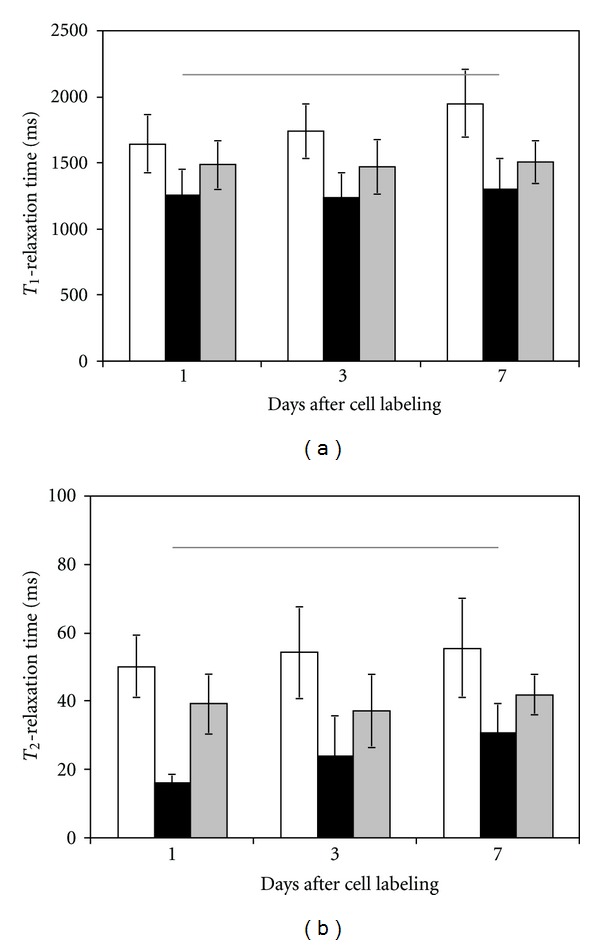
T 1- and T 2-relaxation times in labeled cell pellets over 7 days after labeling. Gd2O3-labeled EC (white), SPIO-labeled SMC (black), and mixed labeled EC and SMC (gray). Horizontal lines indicate relaxation times in unlabeled cells.

T 1- and T 2-relaxation times in labeled cell pellets over 7 days after labeling. Gd2O3-labeled EC (white), SPIO-labeled SMC (black), and mixed labeled EC and SMC (gray). Horizontal lines indicate relaxation times in unlabeled cells.