
Figure 2.
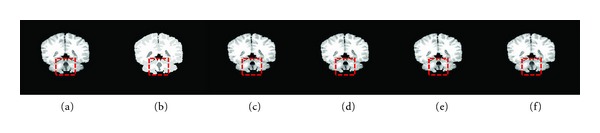
Comparison of the segmentation results on a simulated brain MR image. (a) original T1-weighted image, (b) manual class labeling of gray matter (GM) and white matter (WM) slice regions; results obtained with (c) FCM, (d) MSFCM, (e) FCMT, (f) SFCM, and (g) the proposed approach.