
Figure 2.
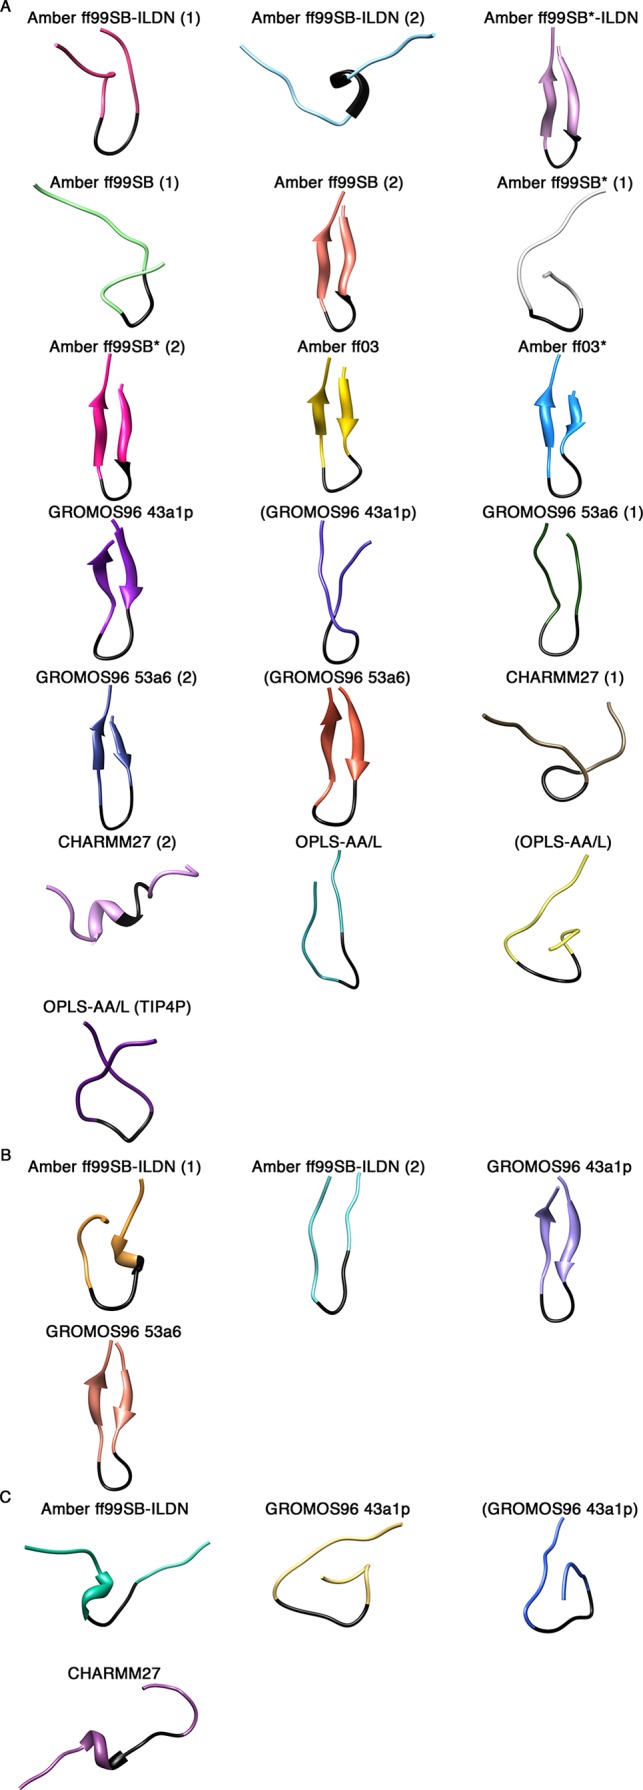
Cluster centroid structures from the last 0.1 μs of the simulations. A single cluster represented all structures in each simulation, and the center structure was extracted. (A) Uncapped peptide. (B) Capped peptide. (C) pThr-80 peptide.
Official websites use .gov
A
.gov website belongs to an official
government organization in the United States.
Secure .gov websites use HTTPS
A lock (
) or https:// means you've safely
connected to the .gov website. Share sensitive
information only on official, secure websites.
Cluster centroid structures from the last 0.1 μs of the simulations. A single cluster represented all structures in each simulation, and the center structure was extracted. (A) Uncapped peptide. (B) Capped peptide. (C) pThr-80 peptide.