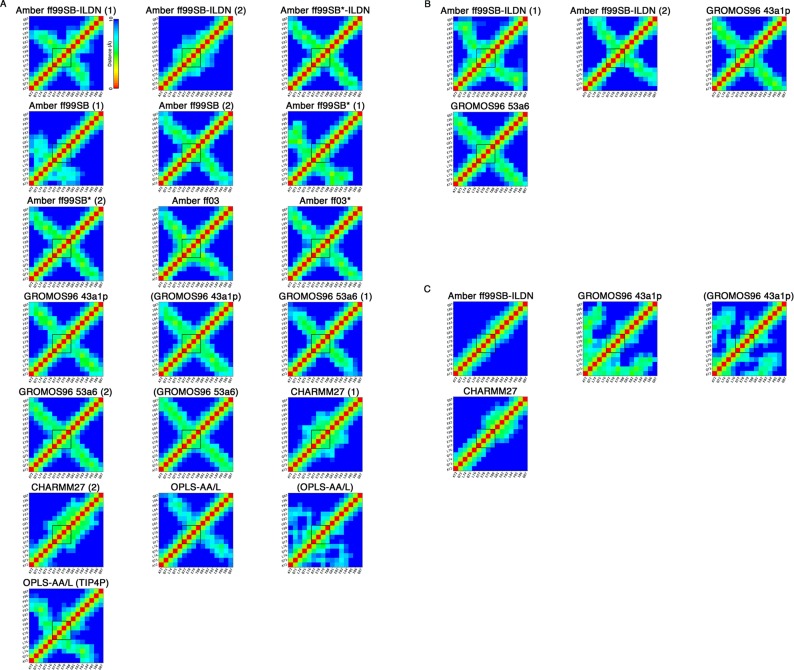
Figure 3.
Cα–Cα atom pair distances. Average Cα–Cα distances less than or equal to 10 Å during the last 0.1 μs of the MD simulations. Distances equal to or greater than 10 Å are colored blue. The black square indicates the β-turn (77DEET80) region. (A) Uncapped peptide. (B) Capped peptide. (C) pThr-80 peptide.

