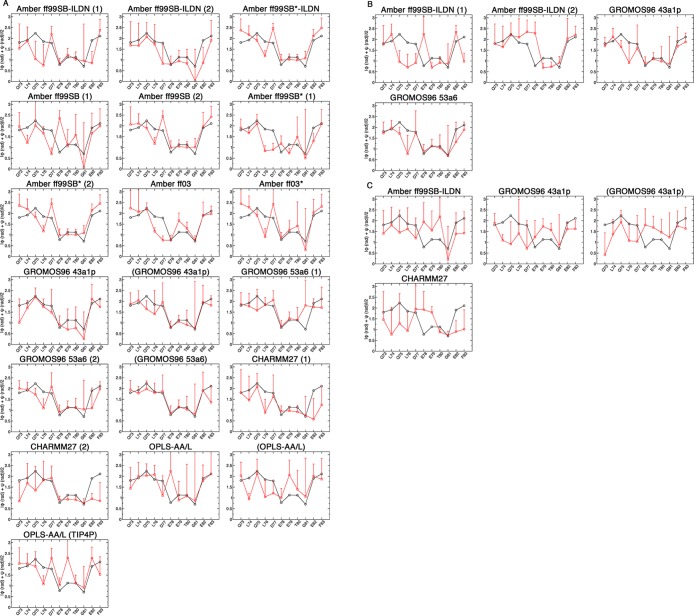
Figure 7.
Comparison of the backbone dihedral angles from the bound state structure and MD simulations. The ϕ and ψ angles for residues 73QLQLDEETGEF83 were converted to radians, and the absolute values were summed and averaged. Black circles indicate the values from the bound state crystal structure (PDB id: 2FLU).31 Red squares are the values over the last 0.1 μs of the simulations. (A) Uncapped peptide. (B) Capped peptide. (C) pThr-80 peptide.

