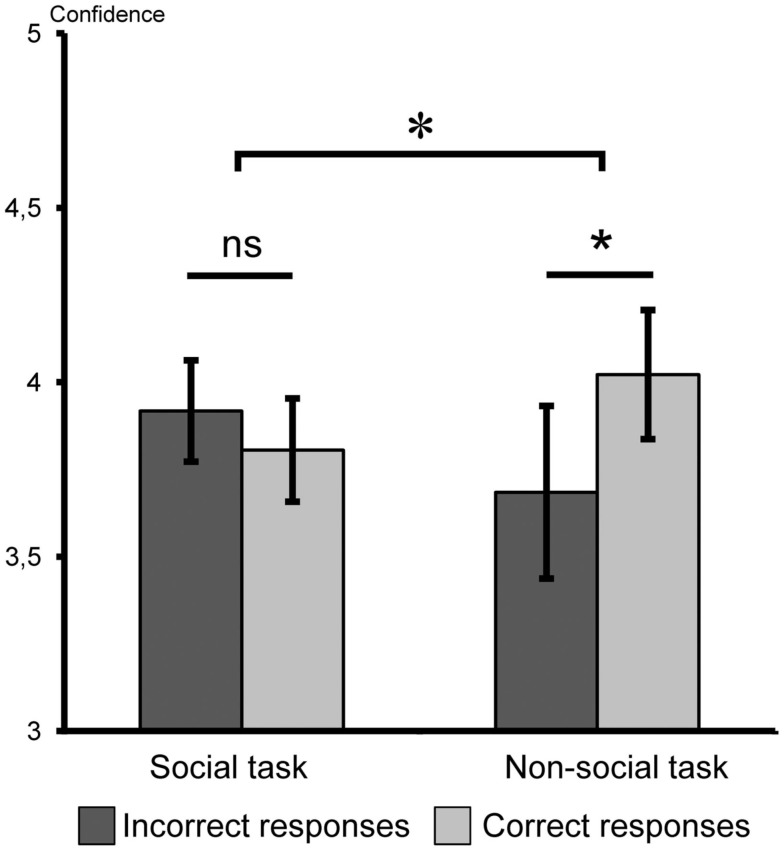
Figure 3.
Experiment 1, mean confidence ratings for correct and incorrect responses in the post-association phase for social and non-social categorization tasks. In light gray, correct responses; in dark gray, incorrect responses; *p < 0.05; ns, non-significant. Error bars indicate standard error of the mean.

