
Figure 1.
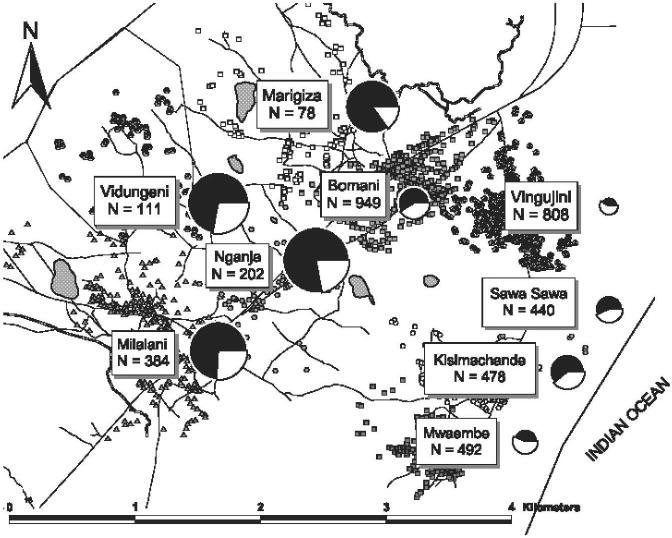
Map of the Msambweni study area on the southern coast of Kenya. Shown are the nine participating villages with their respective numbers of included subjects. To the right of each village label is a pie chart that indicates by internal shading the village prevalence of infection at the outset of the control project, and by relative size the local rate of infection/reinfection over the eight-year follow-up period.