
Figure 3.
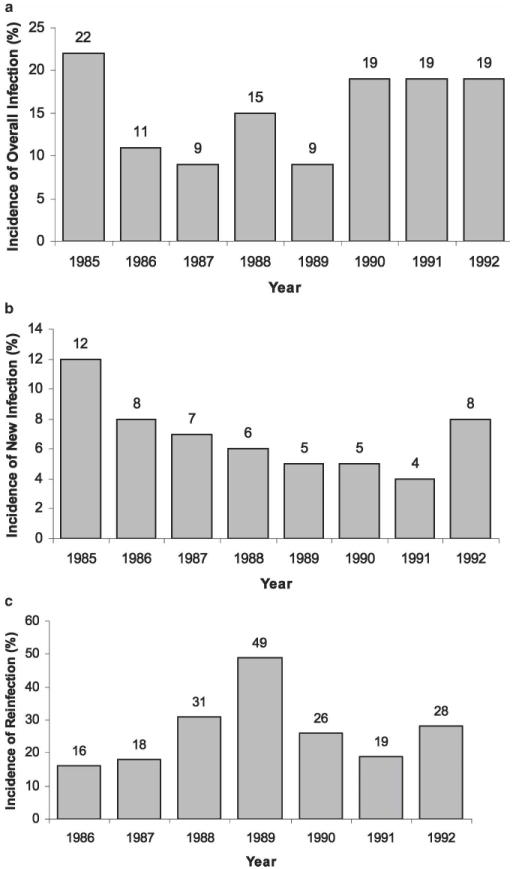
Incidence of schistosomiasis infection and reinfection in the Msambweni study area, by year. Annual rate of infections per 100 population at risk is shown as a percentage for each year, as indicated by the numbers above each bar. a, combined incidence of new infection and reinfection between years 2 and 9 of the study (1985–1992). b, incidence of new infection among previously uninfected subjects, c, incidence of reinfection among treated subjects in the years after a documented parasitologic cure.