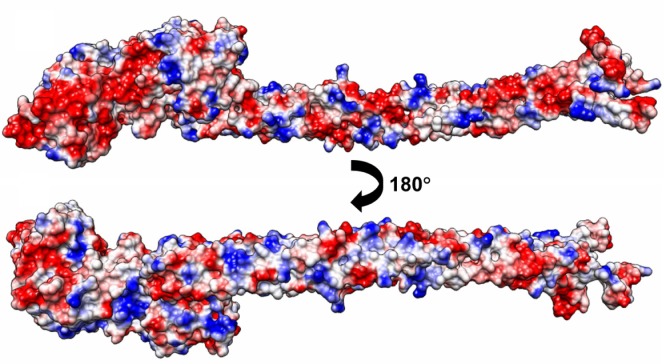
Figure 4.
Electrostatic potential surface diagrams of a fibrinogen (AαBβγ)2 monomer shows a local concentration of positive charge along the coiled-coil rod facing outwards.
Note: The columbic parameters were ε = 4r and thresholds ± 5.93 kcal/mol·e. Negative charge is indicated in red, positive blue, and neutral white. The surface charge was calculated with UCSF Chimera.27
Abbreviations: ε, dielectric constant; r, distance.

