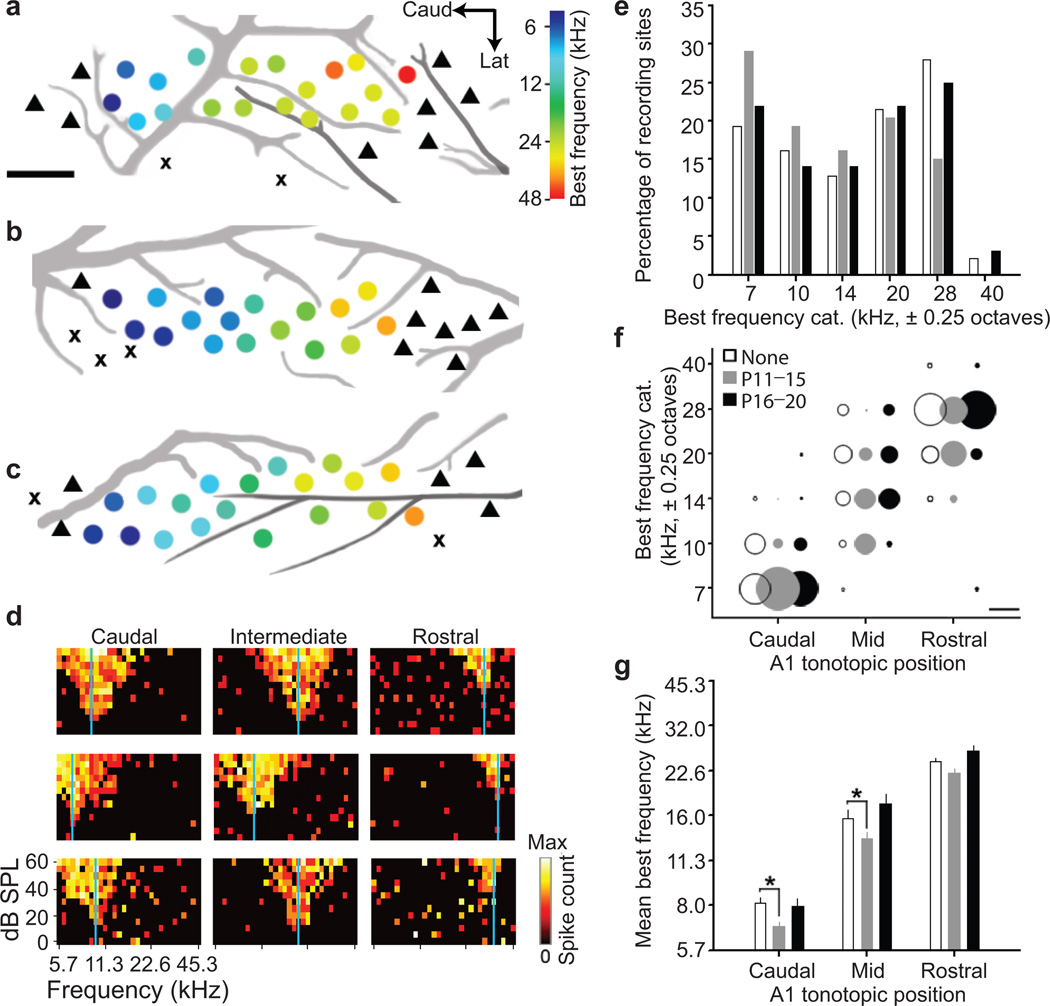
Figure 1. Developmental cortical map reorganization in mouse A1.
Representative A1 best frequency maps from the left hemisphere of young adult mice (P32–39) reared in a normal sound environment (a) or after 7 kHz tone exposure between P11–P15 (b) or P16–20 (c). Circle denotes multi-unit recording site and hue represents best frequency (color scale). triangle = non-A1 recording site, x = non-responsive site. Scale bar, 0.25 mm. Black and grey lines represent branches of the middle cerebral artery and inferior branches of the rhinal vein, respectively. d, Sample frequency response areas of normalized firing rates as a function of tone frequency and level. Recordings obtained from caudal, intermediate and rostral zones of A1 from mice reared in a normal sound environment (top row), or with 7 kHz tones between P11–P15 (middle row) or P16–P20 (bottom row). Vertical blue line indicates best frequency. e, Percentage of recording sites of all best frequency measurements in normally reared mouse A1 (open bars; n=18,15,12,20,26,2 sites for each of the six categories) or those reared with 7 kHz tones between P11–P15 (grey bars; n=27,18,15,19,14,0 sites) or P16–P20 (black bars, n=14,9,9,14,16,2 sites). Best frequencies are grouped into 0.5 octave bins centered on the X-axis frequency. f, Best frequency distributions segregated by rearing condition and topographic location. Percentage of best frequency sites is represented by circle diameter. Scale bar denotes a diameter equalling 50% of the distribution. g, Best frequency values (mean ± s.e.m.) for each rearing group and topographic position. * P<0.05 (t-test).

