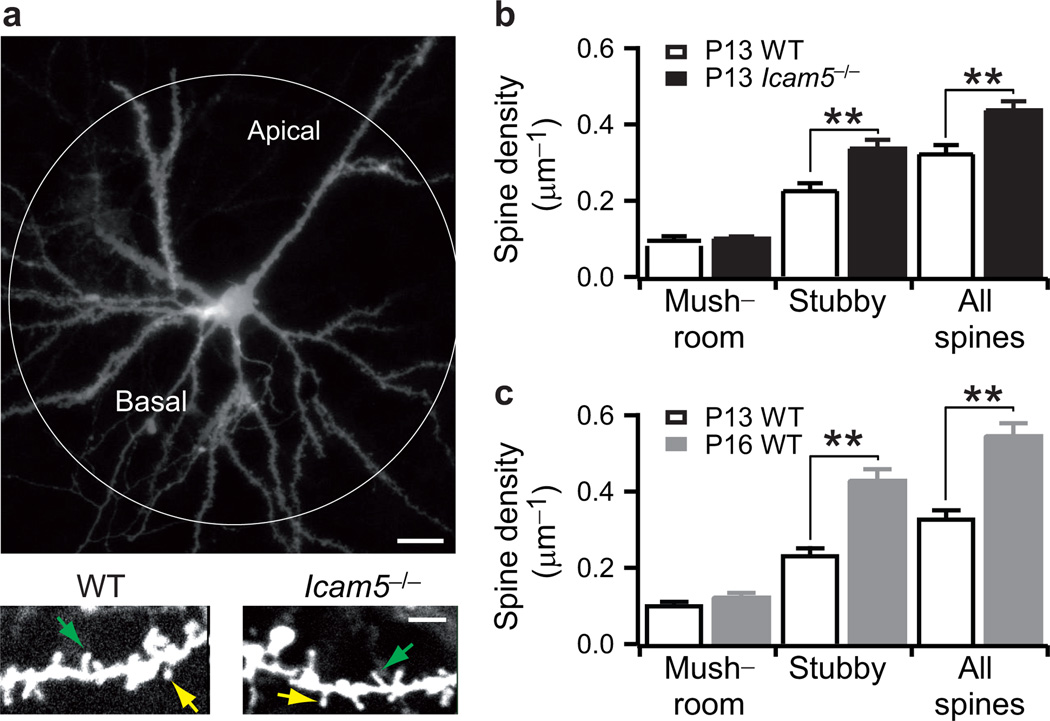
Figure 7. Stubby spine density increases through the critical period.
a, Sample DiI-labeled upper L4 pyramidal cell. Scale bar, 20 µm (upper panel). High-power image of dendrites at P13 revealing mushroom (yellow arrow) and stubby spines (green arrow). Scale bar, 5 µm (lower panel). b, Spine density in P13 wild-type (n=6) and Icam5−/− mice (n=7 neurons). c, Spine density (median±s.e.m.) in P13 (n=6) and P16 wild-type mice (n=7 neurons). ** P<0.01 (Mann-Whitney U test).

