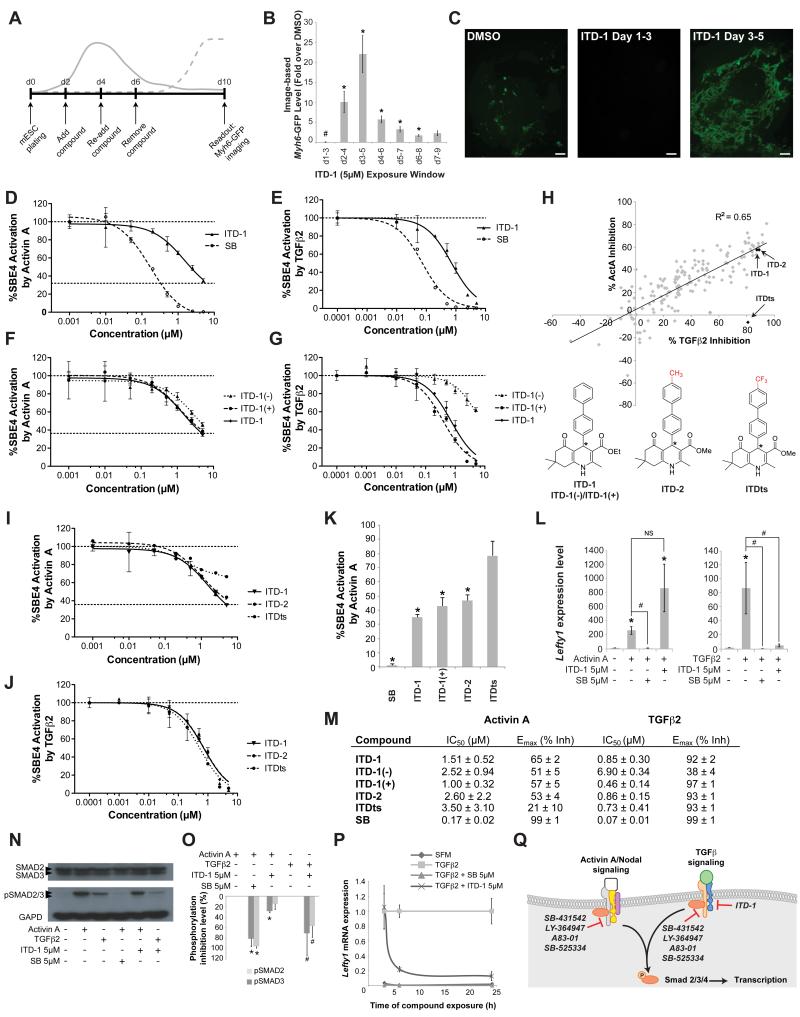
Figure 1. High content screen in mESC identified a novel cardiogenic TGFβ selective inhibitor.
(A) The mESC screening assay that was used to identify compounds that affect cardiac fate at the mesoderm patterning stage. Solid line, mesoderm dynamics and dotted line, emerging cardiomyocytes.
(B-C) Myh6-GFP levels quantified by image analysis in mESC after treating with 5μM ITD-1 over different time windows, normalized to vehicle alone. Note cardiac fate suppression at d1-3 and promotion at later time windows. # p<0.05 for downregulation compared to DMSO vehicle, * p<0.05 for upregulation compared to DMSO (B). Error bars represent standard error of the mean (SEM). Representative day 10 Myh6-GFP images of the biphasic effect of ITD-1. Scale bar, 25μm (C).
(D-E) Inhibition of Smad4 response element-luciferase (SBE4-Luc) activity in HEK293T cells through a dose response of ITD-1 and the ACVR1/TGFBR1 kinase inhibitor SB-431542 (SB) in response to the TGFβ family members Activin A (D) and TGFβ2 (E).
(F-G) SBE4-Luc dose-response curves for ITD-1 and its enantiomers in presence of Activin A (F) or TGFβ2 (G).
(H) SAR analysis of over 200 ITD-1 analogs screened at 5μM against TGFβ2 and Activin A in the SBE4-Luc assay to identify compounds with high selectivity for TGFβ2. One confirmed compound (ITDts) and a structurally similar analog (ITD-2) are indicated with arrows. * chiral center.
(I-J) Dose response curves for ITDts, ITD-2 and ITD-1 against Activin A (I) and TGFβ2 (J) in the SBE4-Luc assay.
(K) Histogram plot representing the residual Activin A activity after treating with 5μM of the indicated compounds, normalized to Activin A alone (100%). * p<0.05 compared to DMSO vehicle.
(L) Functional inhibition of Activin A and TGFβ2 signaling by ITD-1, read out by Lefty1 mRNA levels in Cripto−/− mESC. * p<0.05 compared to no Activin A/TGFβ2 control, and # p<0.05 compared to Activin A/TGFβ2 alone and NS, not significant.
(M) Overview of IC50 values for Activin A/TGFβ2 inhibition and Emax values (shown as % inhibition) of key compounds in the SBE4-Luc assay. represented as average ± SEM
(N-O) Representative Western Blot for SMAD2/3, p-SMAD2/3 and GAPD in ITD-1 treated HEK293T cells after stimulation with TGFβ or Activin A (N). p-SMAD2/3 protein level quantification, normalized for GAPD and total SMAD2/3, plotted as % inhibition (O), * p<0.05 compared to Activin A, # p<0.05 compared to TGFβ2.
(P) Lefty1 mRNA time course analysis in a serum free Cripto−/− mESC assay after TGFβ2 treatment in the presence of ITD-1 or SB. SFM, serum free medium alone.
(Q) Schematic representation of the selectivity and targets of known small molecule inhibitors in respect to ITD-1 (see also Table S3). Error bars represent SEM.

