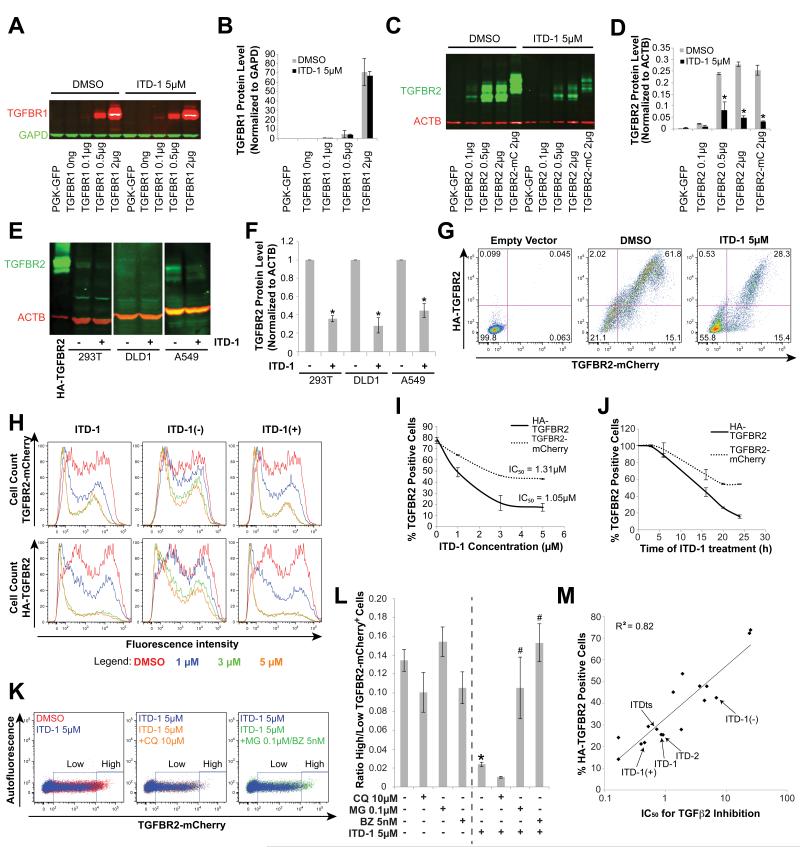
Figure 2. ITD-1 uniquely targets TGFBR2 to the proteasome.
(A-B) TGFBR1 protein levels in HEK293T cells, transiently transfected with different amounts of TGFBR1 plasmid and treated for 24h with 5μM ITD-1. A representative Western blot for TGFBR1 with GAPD as normalizing marker (A) and TGFBR1 protein level quantification, normalized for GAPD (B) are shown.
(C-D) Similarly, TGFBR2 and a TGFBR2-mCherry fusion (TGFBR2-mC) were overexpressed and detected by Western blot (C) and quantified relative to ACTB (D) after 24h of treatment with 5μM ITD-1.
(E-F) Endogenous protein levels of TGFBR2 in HEK293T, DLD1 and A549 cells, with or without 5μM ITD-1. HA-TGFBR2 is shown as blotting control (E). TGFBR2 protein level quantification, normalized for ACTB (F).
(G) A flow cytometry approach, using an extracellularly HA-tagged TGFBR2-mCherry fusion protein, quantified membrane associated (HA-TGFBR2) as well as total levels of TGFBR2 (TGFBR2-mCherry) upon ITD-1 treatment. Control and ITD-1 treated samples are shown.
(H-I) Flow cytometry analysis showing the dose dependent decrease of total (TGFBR2-mCherry) and extracellular TGFBR2 (HA-TGFBR2) for the indicated compounds. Representative histograms (H) and dose response curves based on the percentage of TGFBR2+ cells are shown (I).
(J) Time course analysis of ITD-1 on the percentage of TGFBR2+ cells assessed by flow cytometry with analysis for extracellular (HA-TGFBR2) and total TGFBR2 (TGFBR2-mCherry).
(K) Representative flow cytometry analysis for total TGFBR2 (TGFBR2-mCherry). ITD-1 reduced the TGFBR2-mCherry level per cell (high to low) compared to DMSO vehicle (blue versus red, left panel). Chloroquine (CQ) did not affect TGFBR2-mCherry levels on ITD-1 treated cultures (orange versus blue, middle panel), while MG132 (MG) or Bortezomib (BZ) treatment rescued the ITD-1 effect (green versus blue, right panel).
(L) Ratios of TGFBR2high cells over TGFBR2low cells for DMSO, ITD-1 and/or CQ/MG/BZ treatments, calculated as indicated in panel K. * p<0.05 over DMSO and # p<0.05 over ITD-1 alone.
(M) SAR analysis of highly active (IC50 <2μM), modestly active (IC50 = 2-5μM) and very weak to inactive ITD-1 analogs (IC50 >5μM) correlating SBE4-Luc TGFβ2 inhibition IC50 values with HA-TGFBR2 degradation. Key compounds are indicated with arrows. Error bars represent SEM.

