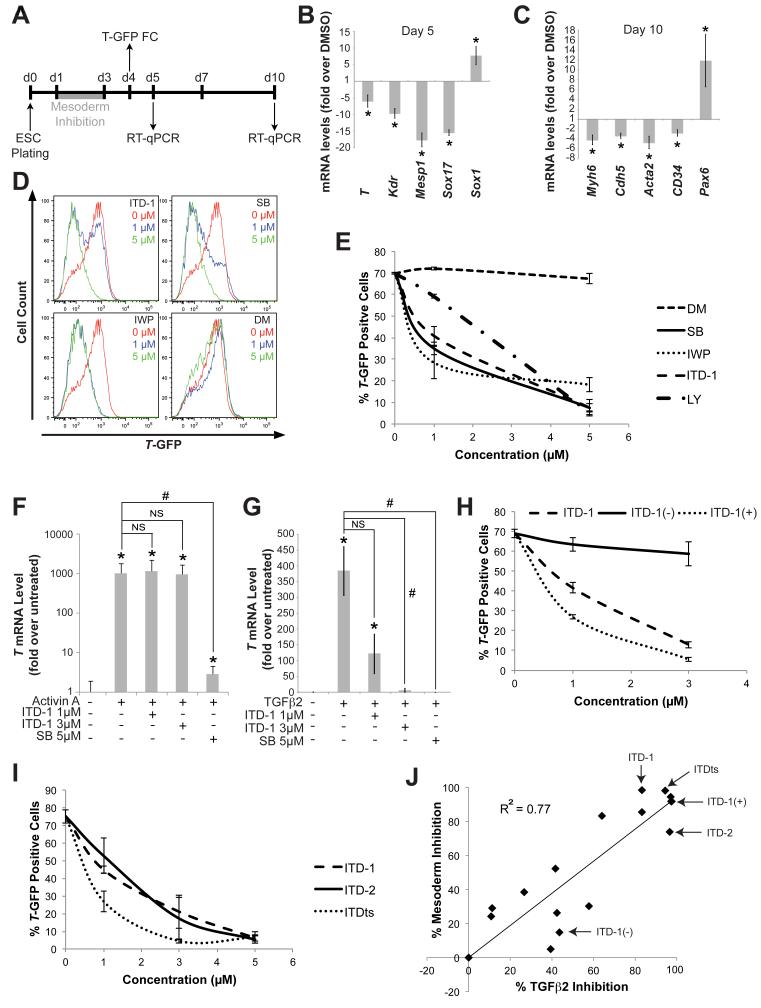
Figure 3. ITD-1 inhibits mesoderm induction in mouse ESC.
(A) mESC differentiation timeline, showing the ITD-1 treatment window (grey bar) and the days of RT-qPCR or T-GFP flow cytometry (FC) analyses.
(B-C) Gene expression analysis of day 5 (B) and day 10 (C) samples after treating mESC with ITD-1 from day 1-3. Markers included mesoderm and endoderm (T, Kdr, Mesp1 and Sox17), neuroectoderm (Sox1), heart (Myh6), smooth muscle (Acta2), endothelium (Cdh5), blood (Cd34) and neuroectoderm (Pax6). * p<0.05 compared to DMSO vehicle.
(D-E) T-GFP flow cytometry analysis of ITD-1; SB-431542 (SB), Nodal/TGFβ signaling inhibitor; IWP, Wnt production inhibitor; and Dorsomorphin (DM), BMP signaling inhibitor treatments on mesoderm induction in T-GFP mESCs. (D) Representative histograms with three conditions are shown: DMSO vehicle (red), 1μM (blue) and 5μM (green) and (E) the quantification of T-GFP+ cells, with the inclusion of a second Nodal/TGFβ signaling inhibitor, LY-364947 (LY).
(F-G) T gene expression in Cripto−/− mESC to assess whether ITD-1 can block the ability of Activin A (F) or TGFβ2 (G) to induce mesoderm. * p<0.05 compared to no Activin A/TGFβ2 control, # p<0.05 compared to Activin A/TGFβ2 alone and NS, not significant.
(H-I) Flow cytometry quantification of T-GFP+ cells after treating with ITD-1 enantiomers (H) and TGFβ selective compounds (I).
(J) SAR profile spanning a wide activity range of ITD-1 analogs, correlating TGFβ2 inhibition (calculated from SBE4-Luc assays) with mesoderm inhibition (calculated from T-GFP flow cytometry analyses). Key compounds are indicated by arrows. Error bars represent SEM.

