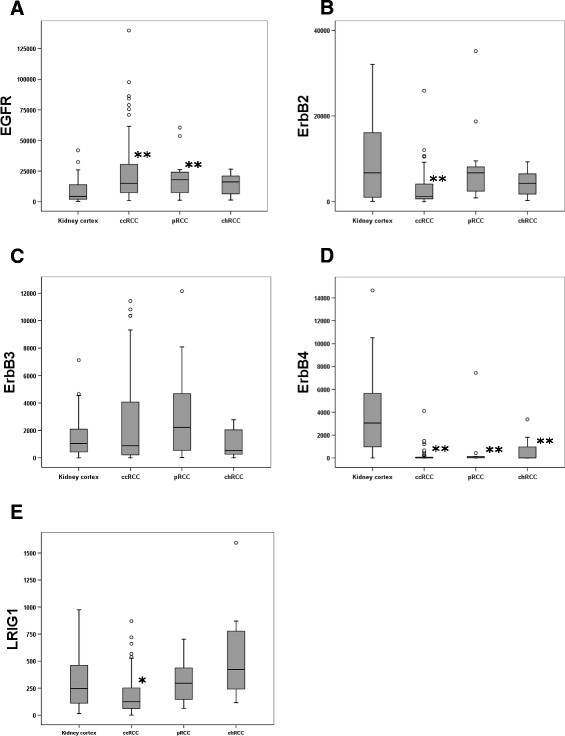
Figure 1 .

Boxplots of the relative mRNA expression of theEGFR-family members andLRIG1in both the kidney cortex and the RCC types. Relative mRNA expression of EGFR, ERBB2, ERRB3, ERRB4, and LRIG1 was quantified in kidney cortex (n = 27), ccRCC (n = 81), pRCC (n = 15), and chRCC (n = 7). (A) EGFR mRNA expression was elevated in ccRCC and pRCC compared to kidney cortex. (Increased expression in chRCC was not significant, but expression levels were similar to other RCC groups.) (B) ERBB2 mRNA expression was significantly lower in ccRCC compared to kidney cortex. In pRCC and chRCC, expression did not significantly differ from kidney cortex. (C) ERBB3 mRNA expression was not significantly different between any of the RCC types compared to the kidney cortex. (D) ERBB4 mRNA expression was significantly reduced in all RCC types compared to kidney cortex. (E) LRIG1 mRNA expression was significantly lower in ccRCC compared to kidney cortex. In pRCC and chRCC, LRIG1 expression did not significantly differ from kidney cortex. Outlier values are marked °. Significant differences compared to expression in the kidney cortex are labeled (*) for P < 0.05 and (**) for P < 0.01.
