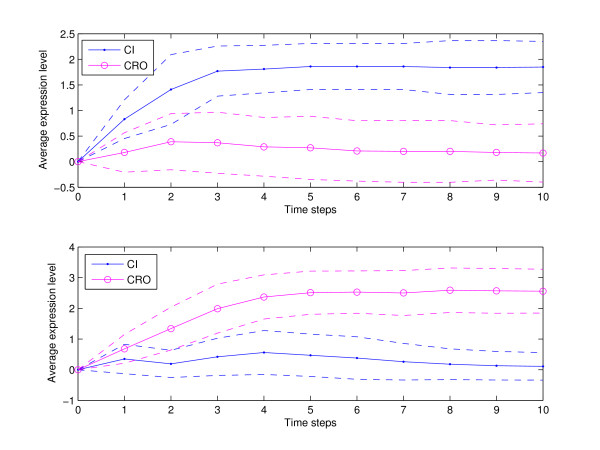
Figure 8.
Cell population simulations. Both figures were generated from 100 simulations, each representing a single cell iteration of ten time steps. Top frame for parameters in Table 2 shows 93% lysis and 7% lysogeny while bottom frame for parameters in Table 3 shows 4% lysis and 96% lysogeny. The x-axis represents discrete time steps while the y-axis shows the average expression level. The initial state for all the simulations is 0000. Solid (circle) points correspond to the average of CI (CRO), and dashed lines represent standard deviations.

