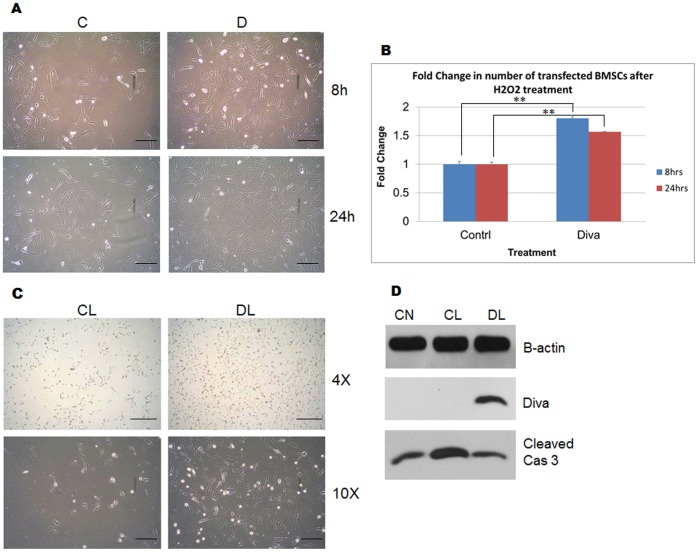
Figure 7. Diva overexpression enhances BMSC protection against oxidative stress and microglial toxicity.
a BMSCs were transfected with empty vector control plasmids and Diva plasmids to assess BMSCs for changes in cell attachment to plate surface following treatment with H2O2. The top panel shows transfected cells 8 hrs after treatment with 20 nM of H2O2, while the bottom panel shows cells 24 hrs after treatment. C and D represent BMSCs overexpressed with control and Diva plasmids respectively. Bar = 100 µm. b MTS assay was used to monitor the changes in transfected BMSC number following treatment with 20 nM of H2O2. Graph showing the fold change of Diva plasmid transfected BMSC number in relation to the negative control after H2O2 treatment for 8 hrs and 24 hrs. Results were statistically significant with p-values <0.01. c Cell attachment images of transfected BMSCs 24 hrs after treatment with LPS activated BV2 supernatant. CL represents control plasmid transfected cells with LPS activated BV2 supernatant. DL represents Diva plasmid transfected cells with the supernatant. Images taken at 4× and 10× magnifications. Bar = 200 µm and 100 µm respectively. d Total protein from BMSCs was harvested to determine protein expression levels of Cleaved Caspase 3 following provocation of transfected cells with LPS activated BV2 supernatant. CN represents control plasmid transfected BMSCs in serum free DMEM. CL represents control plasmid transfected cells with LPS activated BV2 supernatant. DL represents Diva plasmid transfected cells with the supernatant.

