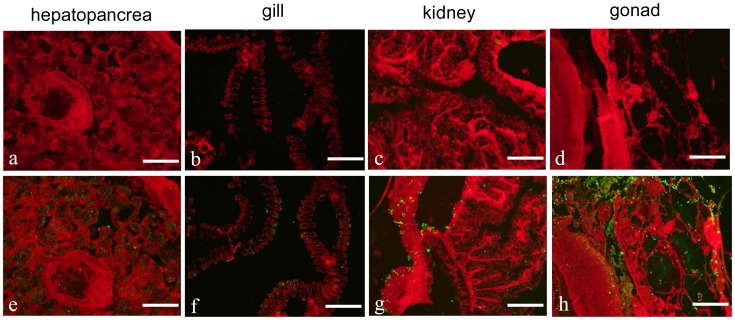
Figure 4. Localization of endogenous CfC1qDC in different tissues using rat polyclonal antiserum.
Binding of antibody was visualized by Alexa Fluor® 488 dye conjugated secondary antibody (green), and the whole tissues were stained with EBD (red). Hepatopancreas (a and e); gill (b and f); kidney (c and g); gonad (d and h). All the bars represent 100 µm.

