
Figure 1.
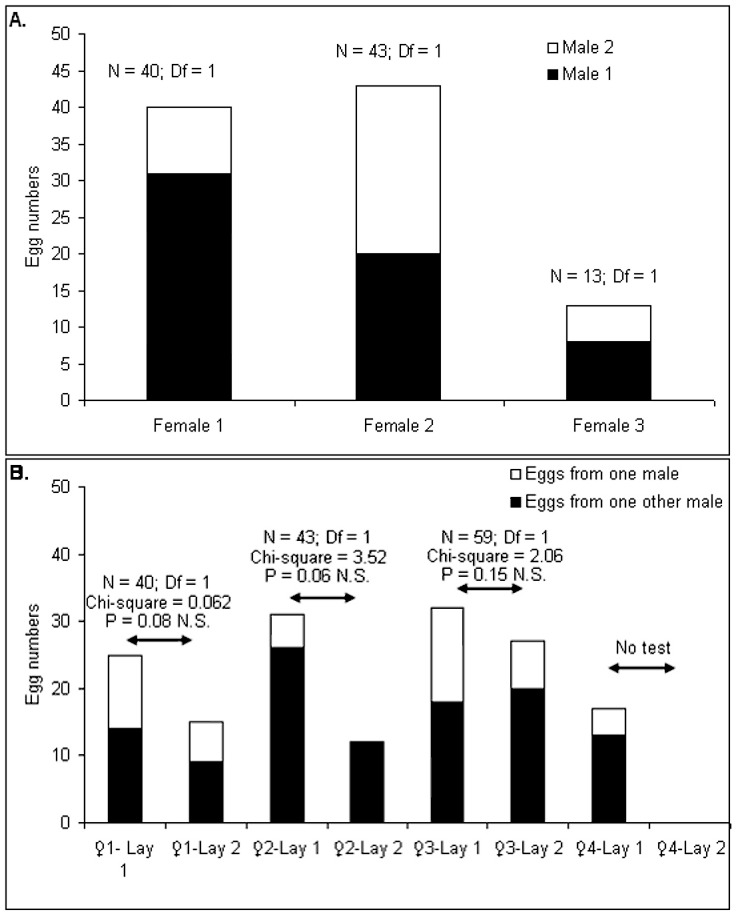
1A. Number of progeny (L3 larvae) from the 3 females inseminated by at least two males during the 1st field sampling. Differences in color (white/black) represent the distribution in the number of larvae coming from one male or from more than one male. 1B. Number of progeny (L3 larvae) from the 4 females inseminated by at least two males during the 2nd field sampling. Differences in color (white/black) represent the distribution in the number of larvae coming from one male or from more than one male. A Chi-square test was performed to test the distribution of sperm coming from male 1 or male 2 between the first and the second egg laying. The 4th female laid only one time. N = number of larvae;, Df = Degree of freedom; N.S. = Non Significant.