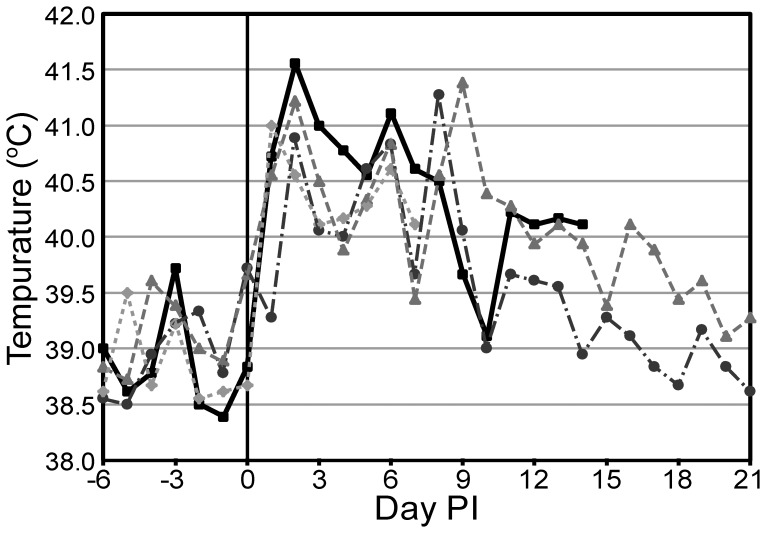
Figure 1. Temperatures from selected goats.
Peaks in temperature are seen on days 1 and 2 and between days 6 and 9. Based on the temporospatial distribution of gross lesions, these peaks are likely associated with bacteremic dissemination events even though bacteremia was not detected with blood culture. BpG15 (square), BpG21 (circle), BpG22 (triangle), BpG27 (diamond).

