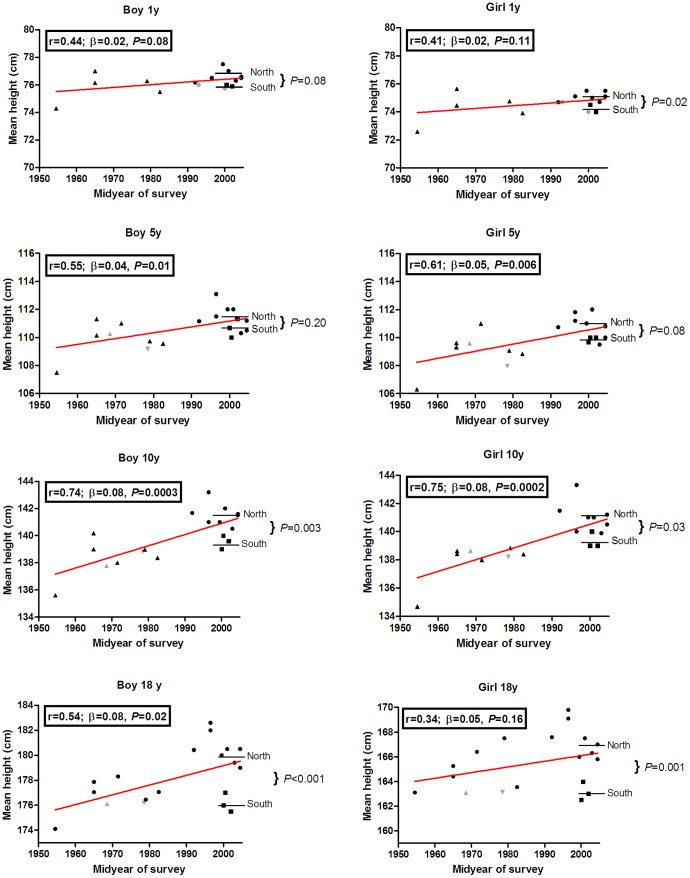
Figure 2. Mean heights by midyear of data collection for different growth charts.
Mean heights are shown for 1, 5, 10, and 18 year old boys and girls (▴ = national growth charts before 1990; ▪ = national growth charts of Southern European countries after 1990; • = national growth charts for Northern European countries after 1990; ▾ = CDC growth charts for 5, 10, and 18 year olds; ▴ = WHO growth charts for 5, 10, and 18 year olds; • = Euro-Growth for one year olds; and ♦ = WHO growth charts for one-year olds; horizontal lines represent the mean height for Northern and Southern Europe in the growth charts based on data after 1990).

