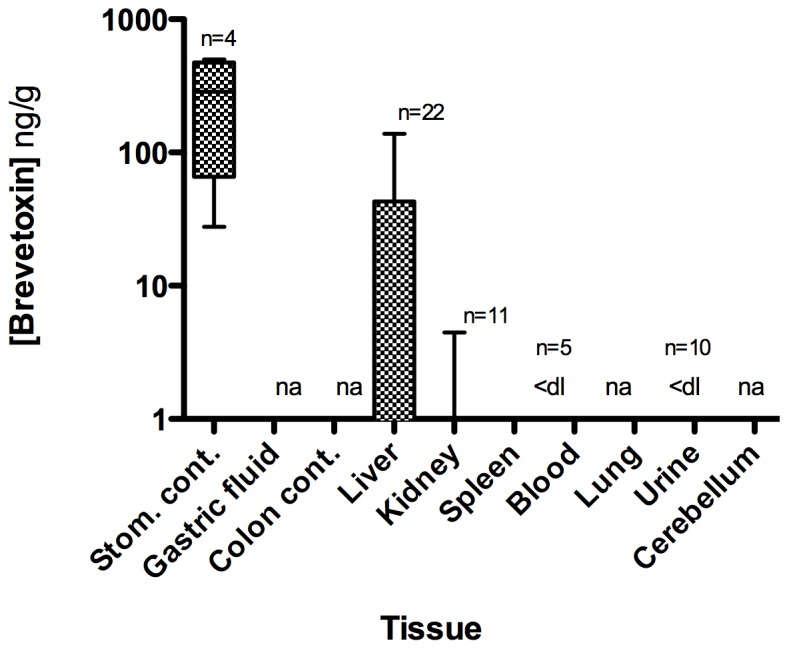
Figure 4. Brevetoxin distribution in various sample types from stranded bottlenose dolphins in the 1999 UME.

Values are reported in ng brevetoxin-3 equiv./g. Data are median, quartile, and minimum/maximum values indicated by the midline, box, and whisker lines; respectively. Note: ‘na’ denotes samples were not available for analysis and “<dl” denotes below the detection limit. The number of animals analyzed for each sample type is represented by ‘n = ’.
