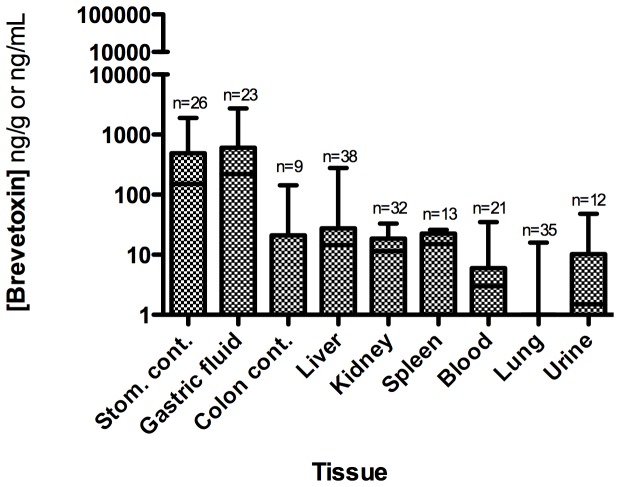
Figure 10. Brevetoxin concentrations in various sample types from stranded bottlenose dolphins in the 2005/2006 UME.
Values (mean calculations of all available assay data) are reported in ng brevetoxin-3 equiv./g or ng/mL. Data are median, quartile, and minimum/maximum values indicated by the midline, box, and whisker lines; respectively. Note: The number of animals analyzed for each sample type is represented by ‘n = ’.

