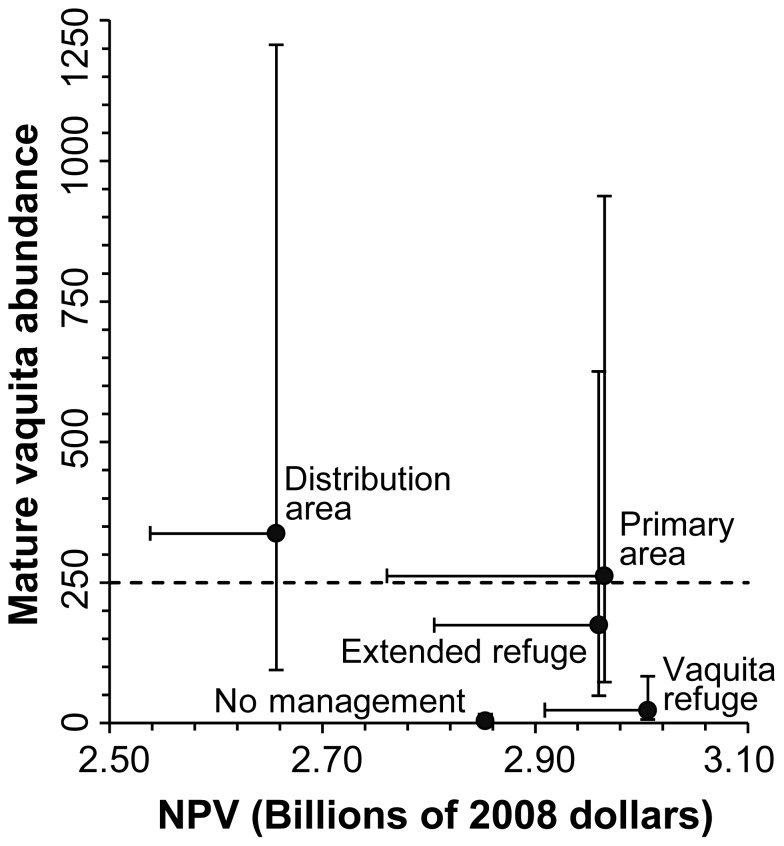
Figure 7. Net present value of fisheries catch for each management scenario, plotted against mature vaquita abundance at the end of the 30 year simulation.
Net present value is discounted benefit over time with an alternate rate of return from bank investment (δ = 3.6%). Markers are results for initial vaquita abundance of 245 individuals and a 10% reduction in shrimp catch in the light trawl relative to the shrimp driftnet. Vertical confidence intervals are mature vaquita abundance results for initial abundance of 68 and 884 and horizontal intervals show 50% reductions in shrimp catch. Dashed line indicates 250 mature individuals, a criterion for downlisting from the Critically Endangered category of the IUCN Red List of Threatened Species™ [11].

