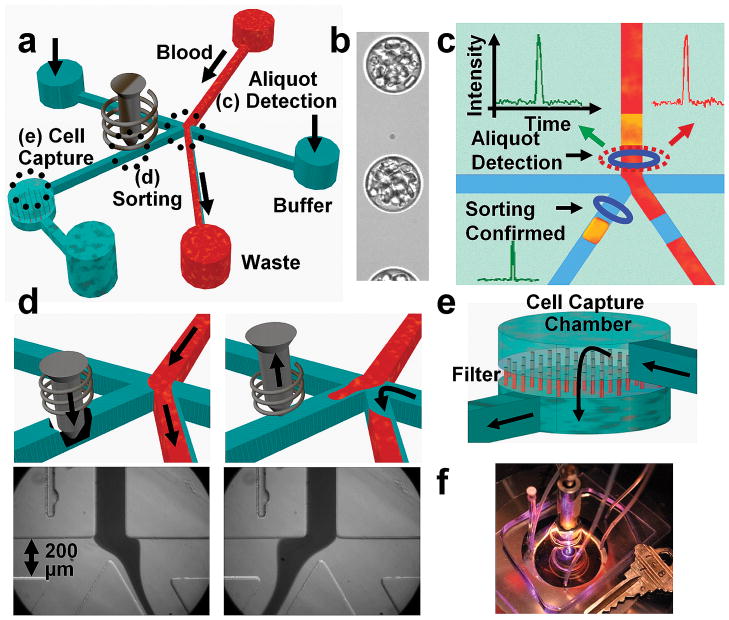
Figure 1.
Schematic and images showing the workings of eDAR. (a) Overview of the microfluidic chip. (b) A high-speed camera image of whole blood aliquoted into a continuous stream of droplets surrounded by silicone oil. (c) Laser-induced fluorescence triggers the sorting of an aliquot containing a rare cell (shown in yellow) to the collection microchannel and cell capture chamber. (d) For sorting, the solenoid piston is released to allow flow through the collection channel; images at bottom show the flow of whole blood when the collection channel is closed (left) and opened (right). (e) The collected aliquots are filtered through a membrane to remove blood cells from the target cells and leave the captured cells isolated and accessible for further study. (f) Photograph of an eDAR chip.

