
Figure 3.
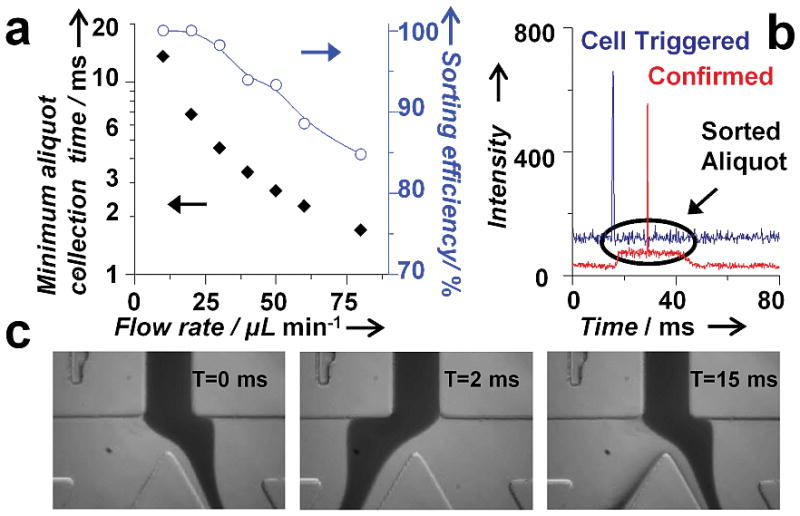
Aliquot sorting efficiency. (a) A plot showing the minimum amount of time required to collect a desired aliquot of blood as a function of flow rate. The collection time was ~ 2.7 ms for 50 μL/min. The plot of sorting efficiency versus flow rate shows highly accurate sorting (up to 100%). (b) Fluorescence trace from a CTC showing the triggering (blue) and successful sorting (red) of an aliquot of blood. (c) High-speed camera images of the sorting junction before and after the release of the solenoid piston that show complete flow switching within 2 ms.