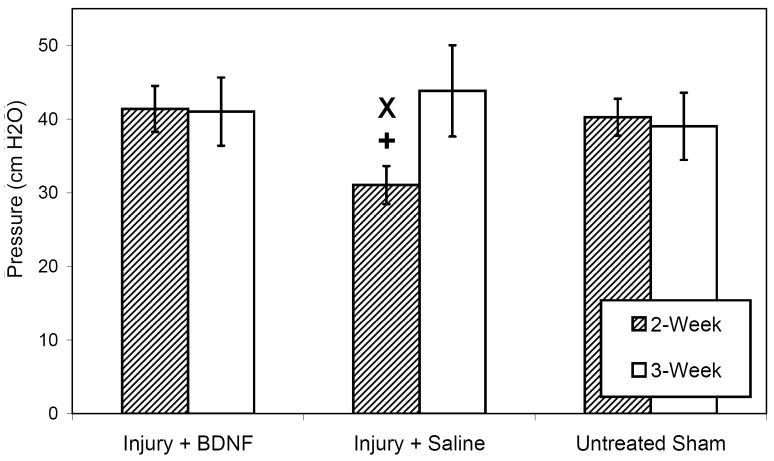
Figure 1.
Leak point pressure in all injury-treatment groups between 2 and 3 weeks as indicated in the legend. Results shown are the means and standard errors of data from 6 to 11 animals. Each symbol represents statistical significance within the same time point as follows: x indicates a statistically significant difference from the sham injury group, while + designates a statistically significant difference from the BDNF treatment cohort.

