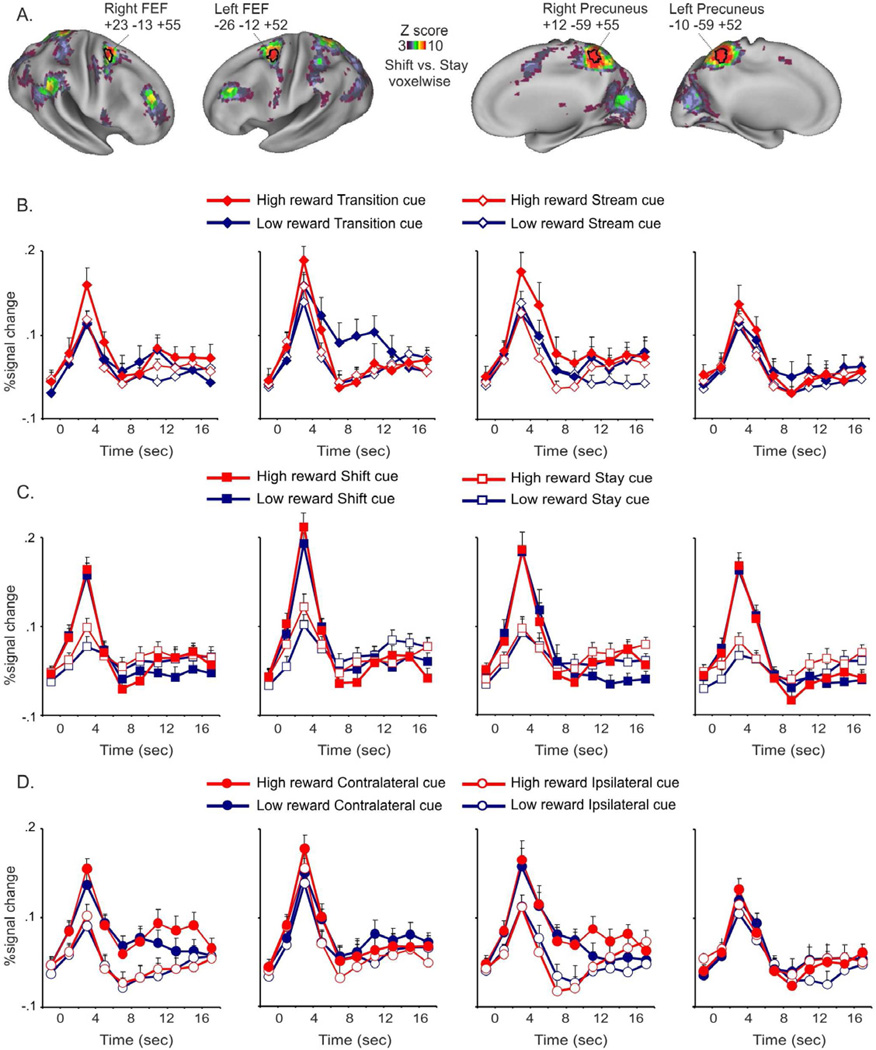
Figure 3. Effects of changes in expected reward magnitude in shift-related regions of dorsal fronto-parietal cortex.
A. Voxels that showed a significantly different activation following shift and stay cues (cue type by time ANOVA map, corrected for multiple comparisons) are superimposed over a lateral and medial representation of both hemispheres of the PALS atlas. Bilateral regions of FEF and Precuneus with the greatest activation peak are outlined in black.
The graphs show the time course of the BOLD signal following high and low reward cues as a function of cue onset position (B), cue type (C), cue location (D) in the FEF and Precuneus ROIs highlighted. Error bars represent within-subjects s.e.m calculated according to Cousineau, 2005.

