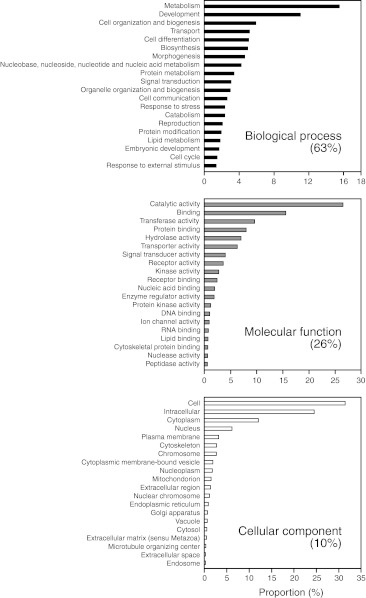
Fig. 1.
Gene ontology category distribution in each of the three main GO domains (biological process [BP], molecular function [MF] and cellular component [CC]) of the European eel. 10,242 out of a total of 186,116 GO terms that were significantly provisionally annotated by Henkel et al. (2012) were first assigned to the three ancestral categories (BP, MF, CC), and subsequent analysis was performed in each category. The percentage indicated just below the three domain names presents the proportions of terms assigned to a category relative to the total GO terms. Top 20 fractions are shown in percentage in the graph for each category

