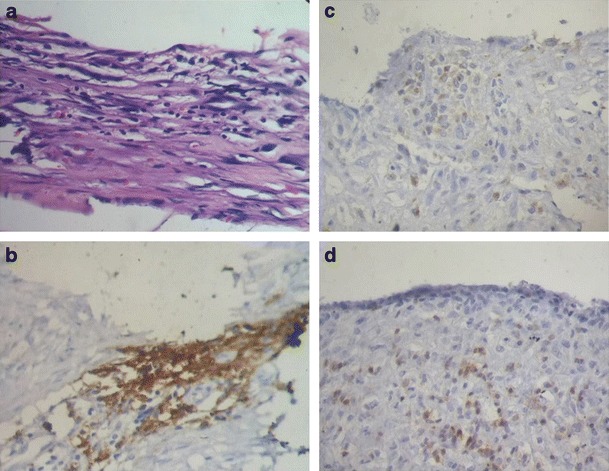
Fig. 3.

a Hematoxylin and eosin (H & E) section showing capsular inflammatory infiltrate (original magnification × 200); b with predominant cd3 + T cell; c and a similar proportion of cd4 + T-helper; d and cd8 T-cytotoxic cells (brown stain in b, c, and d)
