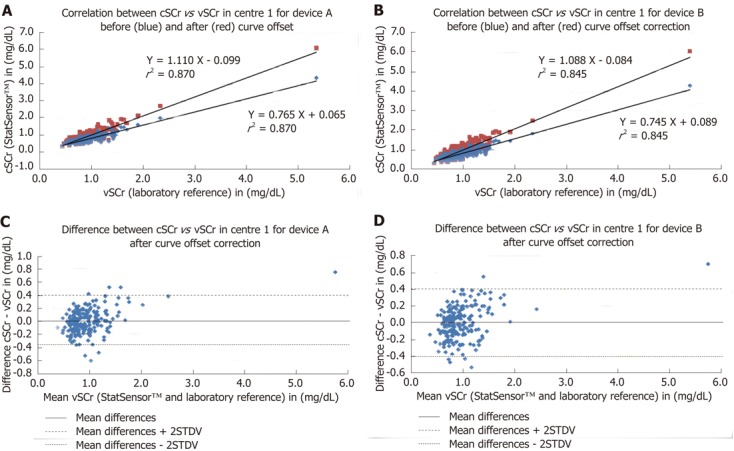
Figure 2.

Scatter plots, regression equations and correlation coefficients for the correlation for capillary point-of-care serum creatinine vs venous point-of-care serum creatinine for centres 1 and device A (A) and device B (B), each before and after implementation of the offset correction. C: The Bland-Altman plot for the differences between capillary point-of-care serum creatinine (cSCr) and venous point-of-care serum creatinine (vSCr) for centre 1 and device A after curve offset correction; D: The Bland-Altman plot for the differences between cSCr vs vSCr for centre 1 and device B after curve offset correction.
