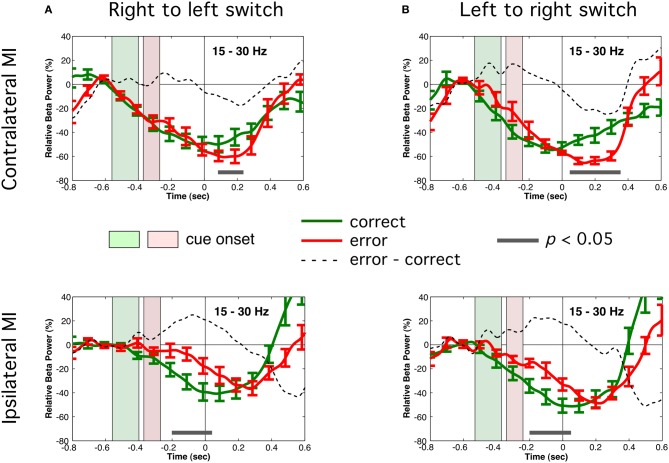
Figure 5.
Time course of total power in the beta (15–30 Hz) band in motor cortex in both bimanual tasks. Contralateral motor cortex (upper row) and ipsilateral MI (lower row) correspond to motor cortex contralateral and ipsilateral to the default response hand, respectively. Correct trials are shown in green and error trials are shown in red. Shaded rectangles show the time range (±1.0 SD around the mean) of visual cue onset for the correct (green shading) and error (red shading) trials. Dotted lines show the difference (error–correct) in beta power. (A) Right to left switch condition (contralateral MI = left motor cortex). (B) Left to right switch condition (contralateral = right motor cortex). Solid grey lines indicate period during which differences between correct and error trials was significant (paired t-test, p < 0.05).

