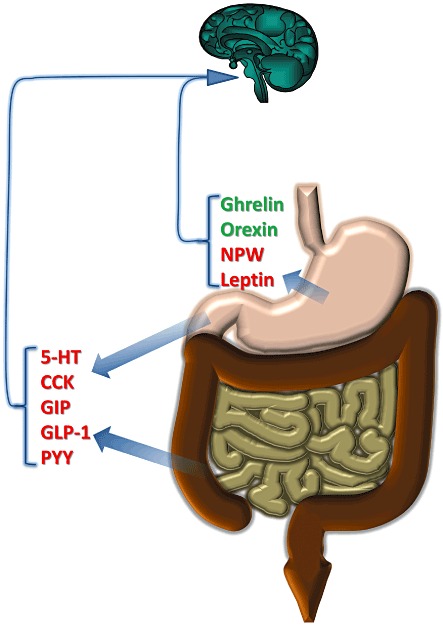
Figure 2.

Release of mediators from different regions and effects on food intake. Red indicates inhibition of food intake; green is promotion. Although many mediators act via vagal pathways, some may instead/in addition directly in the brain. See text for details.
