Figure 4.

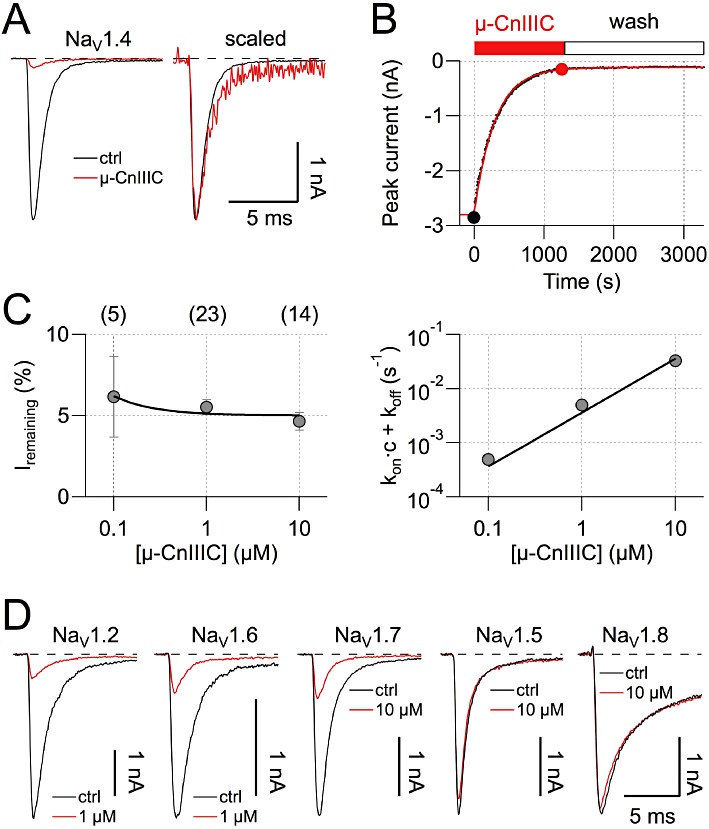
Effect of µ-CnIIIC on voltage-gated sodium channels. (A) Sodium currents at −20 mV recorded from HEK 293 cells expressing rat NaV1.4 channels, under control conditions and in the presence of 1 µM µ-CnIIIC (red). Holding potential was −120 mV, leak was corrected with a p/6 method. The panel on the right shows currents in the presence of toxin scaled and superimposed on the control current, indicating a lack of kinetic changes. (B) NaV1.4 peak current inhibition by µ-CnIIIC and wash-out with a conotoxin-free medium shown as a function of time. The continuous red curve is a single exponential; filled circles indicate data points corresponding to traces shown in (A). (C) The remaining current after toxin equilibration (left) as a function of µ-CnIIIC concentration and the inverse of the time constant characterizing the onset of block (right) as a function of µ-CnIIIC concentration. The number of experiments is indicated in parentheses. The continuous lines are global data fits assuming a first-order reaction yielding an apparent IC50 value of 1.3 ± 0.4 nM and a negligible off-rate. Error bars indicate SEM. (D) Current traces as in A for the indicated channel types before (black) and after application of µ-CnIIIIC at the indicated concentration (red). Traces for rat NaV1.8 channels were recorded from Neuro-2A cells at 10 mV in the presence of 1 µM TTX.
