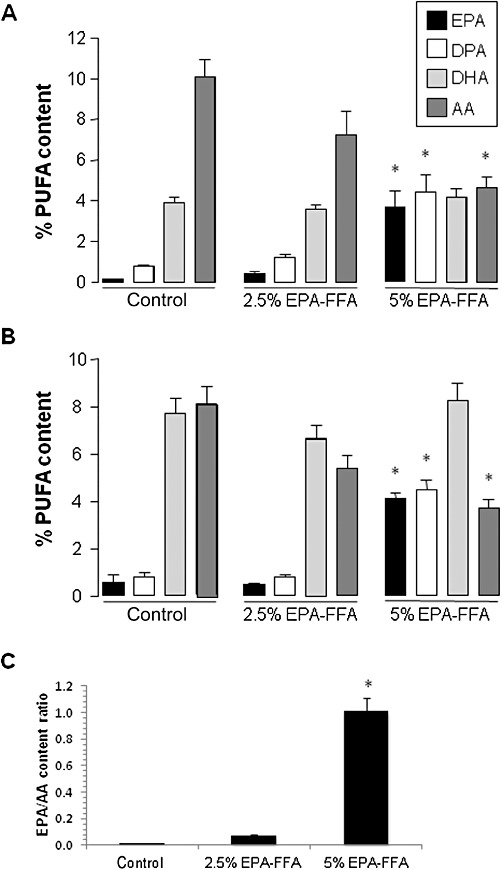
Figure 2.

Changes in PUFA content of MC-26 mouse CRC cell liver tumours and liver tissue associated with EPA-FFA administration. The relative (% total) PUFA content of MC-26 mouse CRC cell tumour tissue (A) and neighbouring liver tissue (B) after exposure to either control or EPA-FFA-containing diets for 28 days. Columns and bars represent the mean and the SEM, respectively, for n= 14 (control and 2.5% EPA-FFA) and n= 10 (5% EPA-FFA) tumours, as well as n= 16 (control and 2.5% EPA-FFA) and n= 14 (5% EPA-FFA) liver samples. *P < 0.01 compared with the control group; one-way anova with post hoc Bonferroni analysis. (C) The EPA/AA ratio of MC-26 mouse CRC cell tumour tissue in the three dietary groups. Columns and bars represent the mean and the SD respectively. *P < 0.05 for the comparison between the 5% EPA-FFA-treated group with control and 2.5% EPA-FFA-treated animals (one-way anova with post hoc Bonferroni analysis).
