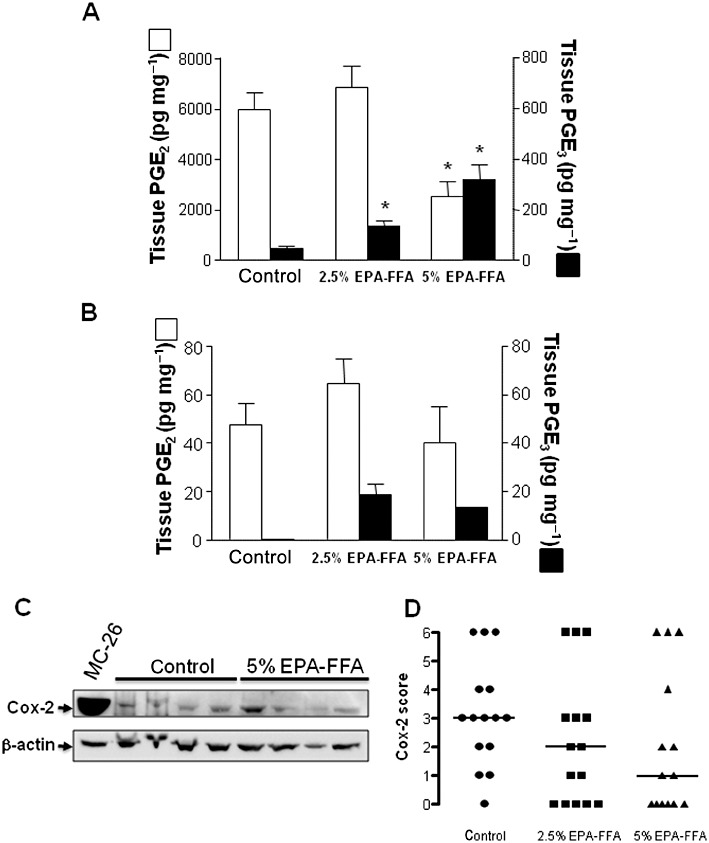
Figure 3.

EPA-FFA administration leads to changes in E-type PG levels in MC-26 mouse CRC cell tumour tissue. PGE2 (open columns) and PGE3 (solid columns) levels in (A) MC-26 mouse CRC cell tumour tissue [n= 15 (control), n= 14 (2.5% EPA-FFA) and n= 7 (5% EPA-FFA)] and (B) neighbouring liver tissue [n= 10 (control), n= 13 (2.5% EPA-FFA) and n= 5 (5% EPA-FFA)] after exposure to either control or EPA-FFA-containing diets for 28 days. Columns and bars represent the mean and SEM, respectively. *P < 0.05; one-way anova with post hoc Bonferroni analysis. (C) Western blot analysis of COX-2 protein in tumour tissue from control (n= 4) and 5% EPA-FFA-treated (n= 4) animals. In each case, 50 µg total protein was loaded. β-actin was probed as a loading control. MC-26 denotes a total protein sample from MC-26 mouse CRC cells cultured in vitro. Densitometry confirmed that there was no significant difference in the COX-2/β-actin ratio between control tumour tissue [mean ratio 5.5 ± 0.4 (SEM) arbitrary units] and tumour tissue from 5% EPA-FFA-treated animals (7.0 ± 1.1 arbitrary units; P= 0.56, Mann–Whitney U-test). (D) Immunohistochemistry for COX-2 in tumour tissue from control (n= 15), 2.5% EPA-FFA-treated (n= 15) and 5% EPA-FFA-treated (n= 14) animals. Data points represent individual COX-2 immunoreactivity scores (see Supporting Information Figure S3) and bars denote median values for each group. There was no significant difference in COX-2 immunoreactivity scores between the treatment groups (P= 0.16; Kruskal–Wallis test).
