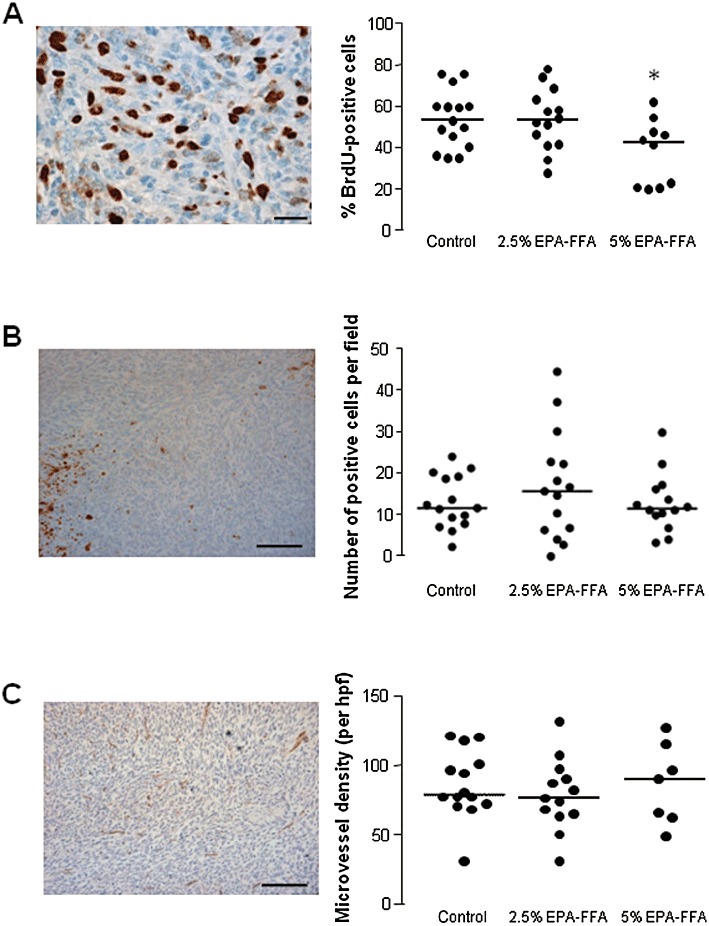
Figure 4.

Biomarkers of MC-26 mouse CRC cell tumour growth in control and EPA-FFA-treated animals. (A) Immunohistochemistry for BrdU: a representative photomicrograph demonstrating brown BrdU-positive MC-26 mouse CRC cells in liver metastasis tissue (size bar = 20 µm) and individual BrdU proliferation index (PI) values in the three treatment groups [n= 16 (control), n= 14 (2.5% EPA-FFA), n= 12 (5% EPA-FFA)]. Bars represent the median value. *P= 0.04 for the comparison with control tumour PI values (Kruskal–Wallis test). (B) Immunohistochemistry for activated caspase-3 (AC-3): a representative photomicrograph (size bar = 100 µm) demonstrating individual brown AC-3-positive MC-26 cells within tumours. Focal areas of high AC-3-positivity were noted in both control and EPA-FFA-treated tumours. Individual AC-3 apoptosis index values in the three treatment groups are presented in the accompanying figure [n= 15 (control), n= 15 (2.5% EPA-FFA), n= 14 (5% EPA-FFA)]. Bars represent the median value. (C) Immunohistochemistry for CD31: a representative photomicrograph of CD31-positive vessels in a MC-26 mouse CRC cell liver tumour (size bar = 100 µm) and individual CD31-positive microvessel density values in the three treatment groups [n= 14 (control), n= 14 (2.5% EPA-FFA), n= 7 (5% EPA-FFA)]. Bars represent the median value.
