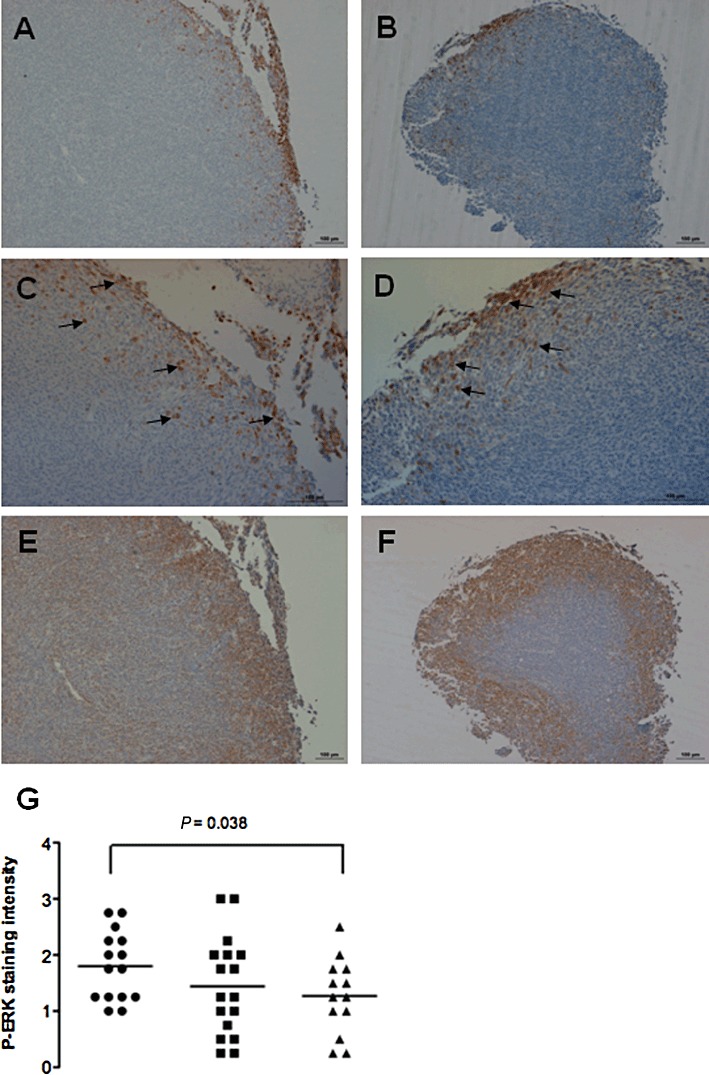
Figure 5.

pERK1/2 immunoreactivity in MC-26 mouse CRC cell tumours is reduced in 5% EPA-FFA-treated animals. Representative low- (A,B) and high-power (C,D) photomicrographs of pERK1/2 staining at the periphery of tumours from control (A,C) or 5% EPA-FFA-treated (B,D) animals. Examples of pERK-positive cells at the invading edge of the tumours are highlighted by arrows. Size bars = 100 µm. (E) and (F) Representative photomicrographs of EP4 receptor staining in the same tumours as above from control (E) or 5% EPA-FFA-treated (F) animals. EP4 receptor immunoreactivity was present throughout MC-26 mouse CRC cells tumours but was most prominent at the periphery of the tumour in a similar distribution to pERK1/2 staining. Size bars = 100 µm. (G) Individual pERK1/2 scores of liver tumours from the three treatment groups [n= 15 (control), n= 16 (2.5% EPA-FFA), n= 13 (5% EPA-FFA)]. Bars represent the median value. *P= 0.038 for the comparison between the 5% EPA-FFA-treated and control groups, Student's unpaired t-test.
