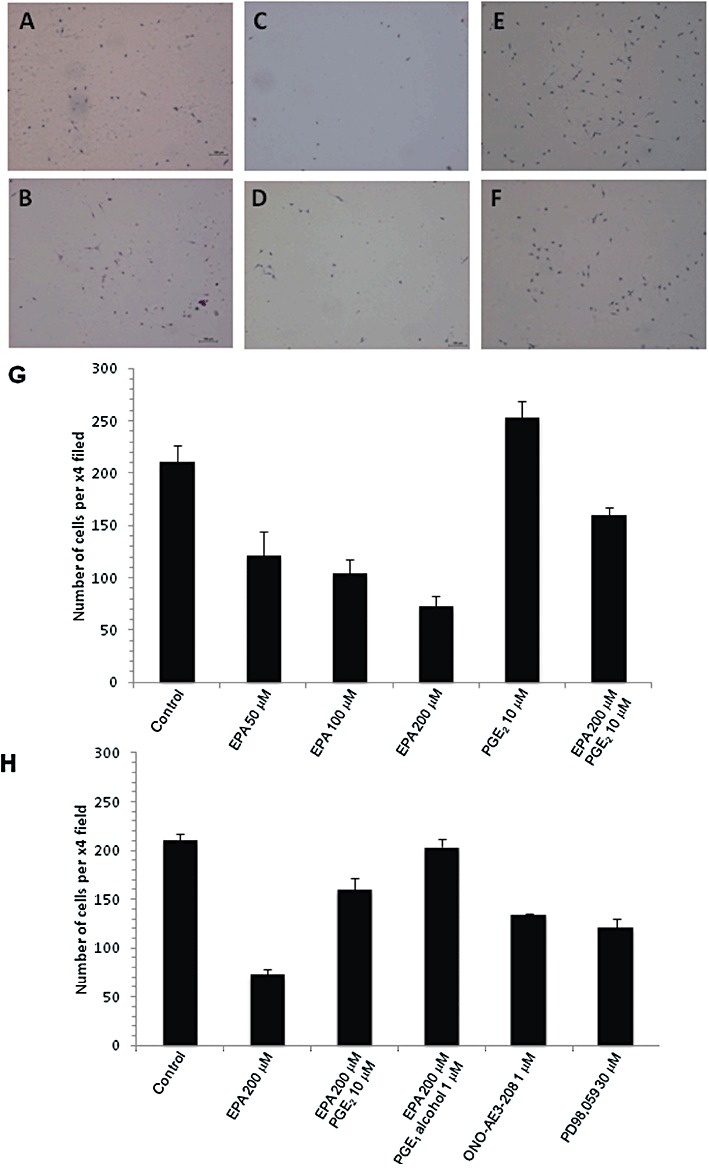
Figure 6.

Effect of EPA-FFA on MC-26 mouse CRC cell motility in vitro. (A to F) Representative photomicrographs of cells following migration through 8 µm membrane pores. Images of control cells (A) and cells treated with either 50 µM (B), 100 µM (C), 200 µM EPA-FFA (D), 10 µM PGE2 alone (E) or a combination of 200 µM EPA-FFA and 10 µM PGE2 (F). (G) Quantification of the effect of EPA-FFA on MC-26 mouse CRC cell migration. Data are expressed as the mean and SEM of the number of cells counted per ×4 magnification field of view from a minimum of three replicates. (H) Quantification of MC-26 mouse CRC cell migration. Data are expressed as the mean and SEM of the number of cells counted per ×4 magnification field of view from a minimum of four replicates.
