Figure 4.
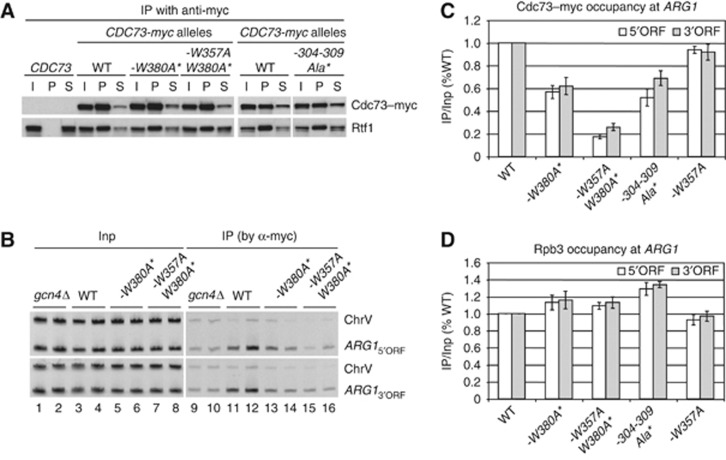
Substitutions in the Cdc73 PCID eliminating binding to pCTD peptides reduce Cdc73–myc occupancies at ARG1. (A) Untagged WT strain BY4741 and the following CDC73-myc13 strains were cultured in synthetic complete medium lacking leucine (SC-Leu) to log phase (A600 of ∼0.6): HQY1147 (CDC73-myc13); HQY1468 (cdc73-W380A-myc13 harbouring low-copy plasmid pHQ1862 with cdc73-W380A-myc13, henceforth abbreviated as -W380A*); HQY1469 (cdc73-W357A,W380A-myc13 harbouring pHQ1861, abbreviated as -W357A,W380A*); and HQY1471(cdc73-6Ala(304-309)-myc13 harbouring pHQ1952, abbreviated as -304-309Ala*). WCEs were prepared and immunoprecipitated with anti-myc antibodies and subjected to Western analysis with anti-myc and anti-Rtf1 antibodies. The last six lanes derive from a separate blot as described in Supplementary Figure S10C. (B–D) ChIP analysis of Cdc73–myc binding at ARG1. The CDC73-myc13 strains described in (A) and CDC73-myc13 gcn4Δ strain HQY1148 were cultured in SC lacking Ile, Val, and Leu (SC-Ilv-Leu) and treated with sulfometuron (SM) for 30 min to induce Gcn4. ChIP analysis was conducted using anti-myc antibodies for Cdc73–myc (B, C) or anti-Rpb3 antibodies for Rpb3 (D). DNA extracted from immunoprecipitates (IP) and input chromatin (Input) samples was subjected to PCR in the presence of [33P]-dATP with the appropriate primers to amplify radiolabelled ARG1 5′ORF or 3′ORF sequences, or sequences from a chromosome V intergenic region (ChrV) examined as a control. PCR products were resolved by PAGE and visualized by autography, with representative results shown for two biological replicates in adjacent lanes of (B), and quantified with a phosphorimager. The resulting values were expressed as ratios of IP to Input signals and normalized to the corresponding ratio for WT CDC73-myc cells. Error bars correspond to standard errors of the mean derived from four or more independent cultures and two independent immunoprecipitations for each culture. (See Materials and methods in Supplementary data for further details on quantification of ChIP data.) Figure source data can be found with the Supplementary data.

